Primer on Fiber Optic Data Communications for the Premises Environment
by
Dr. Kenneth S. Schneider
Table of Contents
Acknowledgements
1. Introduction
1.1
The Fundamental Problem of Communication
1.2 The
Transmission Medium - Attenuation Constraints
1.3 The
Transmission Medium - Interference Constraints
1.4 The
Transmission Medium - Bandwidth Constraints
1.5 The
Transmission Medium - Cost Constraints
1.6
Attractiveness of Fiber Optic Cable As A Premises Transmission Medium
1.7 Program
2. The Fiber Optic Data Communications Link For the Premises Environment
2.1 The
Fiber Optic Data Communications Link, End-to-End
2.2 Fiber
Optic Cable
2.3
Transmitter
2.4
Receiver
2.5
Connectors
2.6
Splicing
2.7
Analyzing Performance of a Link
3. Exploiting The Bandwidth Of Fiber Optic Cable-Employment by Multiple Users
3.1 Sharing
the Transmission Medium
3.2 Time
Division Multiplexing (TDM) With Fiber Optic Cable
3.3
Wavelength Division Multiplexing (WDM) With Fiber Optic Cable
3.4
Comparing Multiplexing Techniques for the Premises Environment
4. Exploiting The Delay Properties Of Fiber Optic Cable For LAN Extension
4.1 Brief
History of Local Area Networks
4.2
Transmission Media Used To Implement An Ethernet LAN
4.3
Examining the Distance Constraint
4.4
Examples of LAN Extenders Shown In Typical Applications
5. Exploiting The Advantages Of Fiber Optic Cable In the Industrial Environment
5.1 Data
Communications In The Industrial Environment
5.2 The
Problem of Interference
5.3 Fiber
Optic Data Communications Products That can Help
6. Serial Data Communications Over Fiber Optic Cable
7. Standards
8. Glossary
Bibliography
ACKNOWLEDGEMENTS
ACKNOWLEDGEMENTS
The idea for writing a monograph on the subject of fiber optic data
communications was proposed to me many times by my assistant, Gail Nelson.
The material in this work was derived from my constant perusal of many diverse
sources spread over my years in engineering. I apologize for not providing a
precise acknowledgment of every source. However, it would have led to a clutter
of footnotes. I know that this often makes for tedious reading and did not want
to burden the reader. Nonetheless, I would not feel comfortable unless specific
credit is given to those publications listed as 'References.' If, on occasion,
I paraphrased any of these works too closely it should be taken in the most
complimentary manner.
Pat O'Hara assisted me in taking a typed manuscript and putting it in final
form complete with graphics, photographs and other illustrations. Pat carries
out this task for all of my publications. She never complains when I come to
her with last minute changes. Her cooperation is really appreciated. I can
truthfully say this work would not have been completed without her assistance.
Note to Pat, we'll soon begin another effort.
Thanks to Doug Honikel for having incorporated this onto our website.
Tony Horber and Bob Ravenstein (Bomara, Inc.) checked the work for technical
accuracy. This was a particularly stressful task especially when it led to
protracted discussions on certain points. I am indebted to them for their
efforts.
Professor Nicholas DeClaris first introduced me to communications engineering
while I was an undergraduate at Cornell University. Professor DeClaris, now of
the University of Maryland, inspired me with his love for teaching and
research. Dr. Irvin Stiglitz later sharpened my communications engineering and
technical writing skills while he was my Group Leader at M.I.T. Lincoln
Laboratory. Needless to say, it is a lot easier to reach Irv's high standards
these days with word processing.
Thanks to Lightwave Magazine and MRV Communications for use of the illustration
for the cover.
Finally, I would like to thank my wife, Diane, my children Andrew, Jessica and
Rachel, my mother and father, Lillian and Irving Schneider and my, close, life
long, friends Seth Stowell, Jamil Sopher and Joel Goldman. In different ways
each gave me encouragement over the years. Without this support I would have
never have reached this point.
*ST is a registered trademark of AT & T
CHAPTER 1
INTRODUCTION
1.1 The Fundamental Problem of Communications
The subject of interest in this book is premises data
communications using fiber optic cable as the transmission medium. This is at
once a very specific yet very extensive topic. It is an important topic both
within the context of data communications today and into the future. All, or
almost all, aspects of this subject will be explored. However, it seems rather
forbidding just to jump into this topic.
Rather, it is more appropriate to take a step back to the very beginning and
talk about the nature of communications first. This will allow some needed
terminology to be introduced. It will also lead us in a natural way to the
subject of fiber optic cable as a transmission medium and to why it is
attractive for premises data links.
Of course, the reader, well versed in data communications, may choose to skip
past this introduction and suffer no real penalty.
The subject of communications really begins with the situation shown in Figure
1-1. Here is an entity called the Source and one called the User- located
remotely from the Source. The Source generates Information and the User desires
to learn what this Information is.
Figure 1-1: Source, User pair with information
Examples of this situation are everywhere prevalent. However, our attention
will only be focused on the case illustrated in Figure 1-2 where the
Information is a sequence of binary digits, 0's and 1's, bits. Information in
this case is termed data. Information of this type is generally associated with
computers, computing type devices and peripherals-equipment shown in Figure
1-3. Limiting Information to data presents no real limitation. Voice, images,
indeed most other types of Information can be processed to look like data by
carrying sampling and Analog-to-Digital conversion.
Figure 1-2: Representations of information
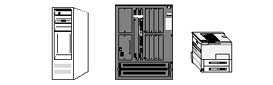
Figure 1-3: Examples of sources and users generating/desiring "data"
It is absolutely impossible in the real world for the User to obtain the
Information without the chance of error. These may be caused by a variety of
deleterious effects that shall be discussed in the sequel.
This means that the User wanting to learn the Information- the binary sequence-
must be content in learning it to within a given fidelity. The fidelity measure
usually employed is the Bit Error Rate (BER). This is just the probability that
a specific generated binary digit at the Source, a bit, is received in error,
opposite to what it is, at the User.
There are some real questions as to how appropriate this fidelity measure is in
certain applications. Nonetheless, it is so widely employed in practice, at
this point, that further discussion is not warranted.
The question then arises as to how to send the binary data stream from Source to
User. A Transmission Medium is employed to transport the Information from
Source to User. What is a Transmission Medium?
A Transmission Medium is some physical entity. As shown in Figure 1-4 it is located between the Source and the User and it is accessible to both. The Transmission Medium has a set of properties described by physical parameters. The set of properties exists in a quiescent state. However, at least one of these properties can be stressed or disturbed at the Source end. This is accomplished by somehow imparting energy in order to stress the property. This disturbance does not stay still, but affects the parts of the Transmission Medium around it. This disturbance then travels from the Source end to the User end. Consequently, energy imparted in creating the disturbance is thereby transferred from the Source end to the User end. Finally, this disturbance or stressed property, can be sensed at the User end. It can be measured.
Figure 1-4: Source, transmission medium, user
This propagation of a disturbance by the Transmission Medium is illustrated in
Figure 1-5.
What are examples of transmission media? As with types of Information there are
many.
Figure 1-5: Disturbance traveling in transmission medium
The Transmission Medium could be air with the stressed property being the air
pressure sound waves. The Transmission Medium could be an electromagnetic field
set up in space by the current put on an antenna, a radio or wireless system.
The Transmission Medium could be a pair of electrical conductors with the
stressed property being the potential difference (the voltage) between the
conductors, an electrical transmission line. The Transmission Medium could be a
sheet of writing paper with the stressed property being the light-dark pattern
on the paper, a letter. The Transmission Medium could be a cylindrical glass
tube with the stressed property being the intensity of light in the tube, a
fiber optic cable.
The Source can have a disturbance to the Transmission medium generated in
sympathy to the Information, that is, generate a disturbance which varies in
time exactly as the Information. This encoded disturbance will then propagate
to the User. The User can then sense the disturbance and decide the identity of
the Information that it represents. The process of the Source generating a
disturbance in sympathy with the Information and launching it into the
Transmission Medium is referred to as modulation and transmission. The process
of the User sensing the received disturbance and deciding what Information it
represents is referred to as reception and demodulation. The device that
carries out modulation and transmission will be called in this work the
Transmitter. The device that carries out reception and demodulation will be
called the Receiver.
The entire situation with data communications then devolves to the model
illustrated in Figure 1-6. Here the Source is generating bits as Information.
The User wants to learn the identity of this Information, these bits. The
entities used to get the Information from the Source to User are the
Transmitter, the Transmission Medium and the Receiver. The fundamental problem
of communications is to choose the terminal equipment, the Transmitter and
Receiver and to choose the Transmission Medium so as to satisfy the
requirements for a given Source-User pair.
Figure 1-6: The model which represents the fundamental problem of communications
The fundamental problem of communications is a design problem. The combination
of Transmitter, Transmission Medium and Receiver is termed the communication
link. Because of the limitation placed on the Information to be a sequence of
bits this combination is generally referred to as a data link. The disturbance
launched into the Transmission Medium by the Transmitter is usually referred to
as the input data signal. The resulting disturbance at the Receiver is termed
the output data signal. In the context of our discussion the fundamental
problem of communications is to design a data link appropriate for connecting a
given Source-User pair.
There is no fail safe cookbook way to solve this design problem and come up
with the best unique solution. While there is science here there is also art.
There are always alternative solutions, each with a particular twist. The twist
provides some additional attractive feature to the solution. However, the
feature is really peripheral to Source-User requirements.
Most exercises in obtaining the design solution usually begin with choosing a
Transmission Medium to meet the general requirements of the Source-User pair.
That is, the data link design process pivots on choosing the Transmission
Medium. Every Transmission Medium has constraints on its operation, on its
performance. It is these constraints that really decide which Transmission
Medium will be employed for the data link design. It will be worthwhile
discussing these constraints.
1.2 The Transmission Medium- Attenuation Constraints
Have a Transmitter launch a disturbance into a
Transmission Medium. Provide an input data signal to a Transmission Medium. As
it propagates down the Transmission Medium to the Receiver its amplitude will
decrease, getting weaker and weaker. The disturbance, the input data signal, is
said to suffer attenuation. The situation is exactly as shown in Figure 1-7.
One immediate question that can be raised is why does attenuation occur? There
are several reasons. It will be worthwhile pointing out and describing two of
them; spatial dispersion and loss due to heat.
Spatial dispersion can best be considered by revisiting Figure 1-7. This
illustrates a one-dimensional propagation of the disturbance. However, often
this disturbance may propagate in two or even three dimensions. The
User/Receiver may be located in a small solid angle relative to the
Source/Transmitter. The received disturbance, the output data signal, appears
attenuated relative to the transmitted disturbance because in fact, it
represents only a small fraction of the overall energy imparted in the
disturbance when it was launched. This is exactly the situation with free space
propagation of waves through an electromagnetic field transmission medium. For
example, this occurs in any sort of radio transmission.
Figure 1-7: Input data signal attenuating as it propagates down a transmission medium
As for loss due to heat, this refers to the basic interaction of the
disturbance with the material from which the Transmission Medium is comprised.
As the disturbance propagates, a portion of the energy is transferred into the
Transmission Medium and heats it. For a mechanical analogy to this consider
rolling a ball down a cement lane. The ball is the disturbance launched into
the lane that represents the Transmission Medium. As the ball rolls along it
encounters friction. It loses part of its kinetic energy to heating the cement
lane. The ball begins to slow down. The disturbance gets attenuated. This is
the situation with using the potential difference between a pair of electrical
conductors as the Transmission Medium.
Attenuation increases with the distance through the Transmission Medium. In
fact, the amplitude attenuation is measured in dB/km. As propagation continues
attenuation increases. Ultimately, the propagating signal is attenuated until
it is at some minimal, detectable, level. That is, the signal is attenuated
until it can just be sensed by the Receiver- in the presence of whatever
interference is expected. The distance at which the signal reaches this minimal
level could be quite significant. The Transmission Medium has to be able to
deliver at least the minimal detectable level of output signal to the Receiver
by the User. If it can not, communications between Source and User really can
not take place.
There are some tricks to getting around this. Suppose the disturbance has been
attenuated to the minimal detectable level yet it has still not arrived at the
Receiver/User. The output signal at this location can then be regenerated. The
signal can be boosted back up to its original energy level. It can be repeated
and then continue to propagate on its way to the Receiver/User. This is shown
in Figure 1-8.
Figure 1-8: Regenerating and repeating an attenuated signal in order to reach the user
Nonetheless, the attenuation characteristics are an item of significant
consequence. The Transmission Medium selected in the design must have its
attenuation characteristics matched to the Source-User separation. The lower
the attenuation in dB/km the greater advantage a Transmission Medium has.
1.3 The Transmission Medium - Interference Constraints
Have a
Transmitter launch a disturbance into a Transmission Medium. Provide an input
data signal to a Transmission Medium. As it propagates down the Transmission Medium
it will encounter all sorts of deleterious effects which are termed noise or
interference. In the simplest example, that of one person speaking to another
person, what we refer to as noise really is what we commonly understand noise
to be.
What is noise/interference? It is some extraneous signal that is usually
generated outside of the Transmission Medium. Somehow it gets inside of the
Transmission Medium. It realizes its effect usually by adding itself to the
propagating signal. Though, sometimes it may multiply the propagating signal.
The term noise is generally used when this extraneous signal appears to have
random amplitude parameters- like background static in AM radio. The term
interference is used when this extraneous signal has a more deterministic
structure-like 60-cycle hum on a TV set.
In any case, when the Receiver obtains the output signal it must make its
decision about what Information it represents in the presence of this
noise/interference. It must demodulate the output signal in the presence of
noise/interference.
Noise/interference may originate from a variety of sources. Noise/interference
may come from the signals generated by equipment located near the
transmitter/transmission medium/receiver. This may be equipment that has nothing
at all to do with the data link. Such equipment may be motors or air
conditioners or automated tools. Noise/interference may come from atmospheric
effects. It may arise from using multiple electrical grounds.
Noise/interference may be generated by active circuitry in the transmitter
and/or receiver. It may come from the operation of other data links.
In obtaining the design solution noise/interference makes its effect best known
through the Bit Error Rate (BER). The level of noise/interference drives the
BER. Of course, this can be countered by having the Transmitter inject a
stronger input signal. It can be countered by having the Receiver be able to
detect lower minimal level output signals. But, this comes with greater
expense. It does not hide the fact that there is concern with
noise/interference because of its impact on the BER.
The susceptibility to noise/interference varies from Transmission Medium to
Transmission Medium. Consequently, during the design process attention has to
be paid to the Source-User pair. Attention has to be directed to the
application underlying the communication needed by this pair and to the BER
required by this application.
The Transmission Medium must then be picked that has a noise/interference level
capable of delivering the required BER.
1.4 The Transmission Medium- Bandwidth Constraints
Go back and consider the model illustrated in Figure
1-6. Suppose the input signal that the Transmitter sends into the Transmission
Medium is the simple cosinusoidal signal of amplitude '1' at frequency 'fo' Hz.
The output signal response to this at the Receiver is designated 'T (fo).' Now
consider the cosinusoidal test input signal frequency, fo to be varied from 0
Hz on up to ¥. The resulting output signal as a function of frequency is T (fo)
or suppressing the subscript- it is T (f). This is referred to as the transfer
function of the Transmission Medium. Generally, the ordinate target value 'T
(f)' for a given frequency 'f' is referred to as the transfer function gain-
actually it is a loss- and is expressed logarithmically in dB relative to the
amplitude '1' of the input signal.
One example transfer function is illustrated in Figure 1-9. This is merely an
example transfer function. It is not to be understood as to be typical in any
sense. It is just an example. However, it does illustrate a feature that is
common in the transfer function of any Transmission Medium that can actually be
obtained in the real, physical, world. The transfer function rolls off with
frequency. The transfer function shown here oscillates, but the maximum value
of its oscillation becomes less and less. Yet, the transfer function itself
never really rolls off and becomes dead flat zero beyond a certain frequency.
This roll off with frequency means that the Transmission Medium attenuates the
cosinusoidal signals of the higher frequencies that are given to it as inputs.
The energy of these higher frequency signals is somehow lost, usually as heat,
in traversing the Transmission Medium. The greater the distance through the
Transmission Medium, the more high frequency signals get attenuated. This is a
consequence of the greater interaction between the propagating signals and the
material comprising the Transmission Medium.
Figure 1-9: Example transfer function of a transmission medium
This roll off feature of the transfer function is present in every Transmission
Medium regardless of how it is derived. It is present in sound waves. It is
present in conductors. It is present in fiber optic cables. It is present in a
phonograph record or tape. It is even present in a sheet of writing paper.
The transfer function shown rolls off with frequency. However, most of its
activity, most of its area, most of its mass, most of its spread, seems to be
below a certain given frequency. In this example it looks like the frequency
'F.' The frequency spread of the transfer function is referred to as its
bandwidth. Of course, from what was mentioned above bandwidth decreases with
the propagation distance through the Transmission Medium.
Because frequency spread is very subjective the measure of bandwidth is also
subjective. When you are discussing communications with someone and they
mention bandwidth it isn't such a bad idea to ask exactly how they are defining
it. There is a definition in the Glossary in the back of this book. However, it
is only one such definition. There are many. For example, there is the 3 dB
bandwidth, mean square bandwidth, first lobe bandwidth, brick wall bandwidth
and on and on. In a study carried out seventeen years ago the author easily
identified over twenty-five separate definitions of bandwidth. All have
validity. Whether one is meaningful or not depends upon the context, actually
the application, in which it is being used. One definition may be appropriate
for describing satellite communication links and another more appropriate for
an FCC official considering the request for a broadcast AM radio license.
In any case, a Transmission Medium has a transfer function and the frequency
spread of this transfer function is measured by the bandwidth. The bandwidth
parameter has implications with respect to the performance of the data link
being designed.
In order to see this consider the illustration shown in Figure 1-10. Here the
Source is generating data, '0's and '1's every T seconds. Let T= 1/R, in which
case the Source is generating data at R bits per second of BPS. To send this
data to the User the Transmitter is generating either a positive or negative
impulse every T seconds. What is an impulse? It is an infinitesimally narrow
pulse, but it is infinitely high so that it has energy of '1.'
Now what comes out at the Receiver in response to the positive impulse sent at
time zero to represent the binary data bit '1.' An example result is
illustrated in Figure 1-11. Notice that this response out of the Transmission
Medium to the input impulse is a pulse spread out in time with its center at t
seconds where t is not equal to 0 seconds. This output is only an example. It
can not even be called typical. However, it does indicate a property that is
typical of all output signals received from the Transmission Medium. The time
spreading of the output pulse is this common property. It is called time
dispersion. It is a result of the finite bandwidth of the Transmission Medium.
To be exact, it is due to the fact that the transfer function of the
Transmission Medium- and any Transmission Medium- attenuates the higher
signals.
Figure 1-10: Binary data from source represented by impulse train put into transmission medium by transmitter. Impulses are T seconds apart.
Look closely at the output signal pulse shown in Figure 1-11. Because it is
spread in time it is going to interfere with the output pulses due to input
data signals which will come after it. These are not shown in the illustration,
but the implication should be clear. Likewise, these subsequent data signals
will generate output pulses that will also be spread in time. Each will also interfere
with the pulses coming after it and also coming before it. This type of
interference is called intersymbol interference. It is not just a consequence
of the input signals being impulses. An input signal, of finite duration, and
of any shape will generate an output signal with time dispersion.
As the data rate from the Source increases the intersymbol interference problem
gets worse and worse. Output pulses with time dispersion get squeezed next to
one another. The growing level of intersymbol interference makes it harder and
harder for the Receiver to demodulate these signals.
To some extent the intersymbol interference can be undone by sophisticated
signal processing in the Receiver. This usually goes under the name of
equalization. However, in many cases equalization still can not deliver the
data from the Receiver with the BER required by the Source-User pair. In other
cases, the data being generated by the Source, say R BPS, is so high that an
equalizer can not be obtained fast enough to keep up with the output signals.
Figure 1-11: Input signal is positive impulse. Resulting output signal shows time dispersion
In considering the data link design task the first line of defense against time
dispersion and intersymbol interference lies in the proper selection of the
Transmission Medium. The larger the bandwidth of the Transmission Medium the
fewer high frequency components will be attenuated during propagation and the
smaller the time dispersion. As a result, there will be less interference
between different output pulses. Make no mistake. Intersymbol interference will
not disappear. It is just that it will be lessened and made more tolerable as the
bandwidth gets larger. In particular, to lessen intersymbol interference the
bandwidth of the Transmission Medium must get larger in relation to the
Source's generated bit rate, R BPS.
The Transmission Medium must be selected to accommodate the bit rate generated
by the Source. This is a critical step in the data link design effort. The
Transmission Medium must have sufficient bandwidth so that it will generate
tolerable intersymbol interference at the Receiver. This means selecting a
Transmission Medium that has a bandwidth that is some multiple of the bit rate,
R. A number of rules of thumb are often used to do this. However, they are too
specific and not worth discussing at this point especially since the measure of
bandwidth is subjective.
The important point is that as the data rate requirement, R, goes up, this
limits the selection of Transmission Medium candidates. It limits the selection
to those with bandwidths matched to it.
The information technology explosion in the world has made this selection task
ever more challenging. Continuously, PCs are becoming more powerful. More
complex applications programs can be run and are finding their way into easily
usable software. As a result, the Source bit rate requirement is growing at an
order of magnitude every few years. To put this in perspective, consider that
just ten years ago a Transmission Medium would be quite acceptable if it had a
bandwidth matched to a Source bit rate of 9,600 BPS. This Source bit rate was
typical of that generated by most data equipment applications. Today with the
growing demand for video services and the plethora of graphics in computer
applications the demand more often than not is for a Transmission Medium with a
bandwidth matched to Source bit rates well upwards of 1 MBPS, possibly 1 GBPS.
1.5 the Transmission Medium - Cost Constraints
You may
be able to find the ideal Transmission Medium relative to attenuation,
interference and bandwidth. But, you still may not be able to select it as part
of the solution to the data link design problem. Why? It simply costs too much.
The expense that it presents is beyond the budget allowed for the Source-User
communications.
This isn't anything new or revolutionary. Money doesn't drive the world. But,
it sure has a tremendous influence on the ultimate choice of solution to any
problem based in technology. This was true one hundred years ago and true
today.
1.6 Attractiveness of Fiber Optic Cable As A Premises Transmission Medium
Considering this discussion of the constraints on the
Transmission Medium we are naturally led to fiber optic cable as an attractive
choice for the data link design. Why? When compared with other candidates for
the Transmission Medium commonly employed today, there is no comparison when it
comes to attenuation, interference and bandwidth.
Illustrations can tell the story best here.
Take a look at Figure 1-12 first. This shows the attenuation of several
candidates for the Transmission Medium. All are based on electromagnetic
technology and all are in common use today. In other words none are laboratory
curiosity items. Attenuation in dB/km is shown as a function of frequency. Here
frequency would more or less refer to the data rate from the Source or
equivalently the signaling rate from the Transmitter. Attenuation of an
electromagnetic Transmission Medium increases with frequency due to effects on
an atomic level, which are well beyond this discussion. The attenuation curves
of different Transmission Medium candidates are shown as shaded strips because
the exact attenuation tends to vary from sample to sample as well as
manufacturer to manufacturer. However, the general trend can easily be grasped.
The attenuation of the two fiber optic cable types, multi-mode and single mode,
are much, much, less than the other candidates. What is more their dependence
upon frequency is even flat over quite a large range. This makes designing data
links with them simpler. You need not be concerned with the change in
attenuation every time you decide to tweak the data rate.
To be absolutely clear the fiber optic cable attenuation shown in this figure
is for fiber optic cable fabricated totally from glass (silica). That is, it
has a glass core and glass cladding. There is also fiber optic cable fabricated
totally from plastic and fiber optic cable having a glass-silica core with a
plastic cladding (PCS- Plastic Clad Silica). It is the pure glass- silica based
fiber optic cable that has the low attenuation properties. The plastic based
fiber optic cable has much higher attenuation, well above coaxial cable. But,
it does have some attractive features that will be discussed in a later
chapter.

Figure 1-12: Attenuation versus frequency (Courtesy of Siecor Corporation)
You get the idea. When it comes to considering the attenuation issue then fiber
optic cable is the unchallenged selection for the Transmission Medium.
Fiber optic cable is fabricated from glass or plastic. Because of the nature of
this material it allows signals transmitted through fiber optic cable to be
immune from electromagnetic based forms of noise and interference. This
includes power transients that may arise from lightning strikes. It includes
noise arising from ground loops. In fact, fiber optic cable provides nearly
perfect isolation between multiple grounds. Noise can still affect a fiber
optic data link; especially, if it is generated in the receiver or transmitter
electronic circuitry. However, the effect of noise and interference originating
outside the link is far less than with competing choices for the Transmission
Medium, candidates like shielded or unshielded twisted pair cable or coaxial
cable or free space microwave radio.
Take a look at Figure 1-13. This illustrates the variation of the bandwidth of
fiber optic cable with its length. Remember bandwidth goes down with increasing
length. But, that is not the concern here. Notice that at up to 4 km the
bandwidth is always above 10 MHz. This implies that a fiber optic link can
support data rates of many 10's of MBPS over these distances. This can be done
without having to have the Transmitter resort to any sophisticated bandwidth
efficient modulation schemes. Of course, people talk about fiber optic cable being
able to support Giga Bits Per Second (1 Billion Bits Per Second - GBPS) and
even Tera Bits Per Second (1 Trillion Bits Per Second). But, remember this
depends upon distance and may often require multiple repeaters.
Figure 1-13: Bandwidth of fiber optic cable vs. length (from Fiber Optic Communications, Joseph C. Palais)
To put this in perspective, unshielded twisted pair copper cable over this
distance can support 0-to-100 MBPS. Coaxial cable this distance can support
about 20 MBPS. When it comes to the bandwidth issue fiber optic cable is the
unquestioned most attractive candidate for the Transmission Medium.
Fiber optic cable is the unchallenged winner in the Transmission Medium
sweepstakes when it comes to attenuation, interference and bandwidth. It even
has some additional features that are attractive in comparing it to other
candidates mentioned. It is the most secure. Tampering with fiber optic with
transmissions through fiber optic cable is very difficult to do. It can be
detected far more easily than with the other metallic based candidates for
Transmission Medium let alone free space propagation candidates. The small size
of fiber optic cables allows it to be placed in ducting that is too small for
metallic cable. This allows room for substantial growth in capacity if needed.
It's easier to put more fiber optic cables in the same duct. This is brought
out in the photograph provided in Figure 1-14. Finally, fiber optic cables do
not conduct electricity- they are glass or plastic therefore safer. They are
particularly suitable for use in areas that might have spark or electrical
hazard restrictions. This is especially true of places that may endanger the
well being of a technician working with a long segment of metallic cable
instead of a fiber.
Figure 1-14: Size comparison: coaxial cable and fiber optic cable (Courtesy of AT&T Archives)
Undoubtedly now you are saying So fiber optic cable is the winner when it comes
to attenuation, interference and bandwidth. But, doesn't high cost throw it
out? Isn't it very expensive and wasn't this the ultimate driver for the
Transmission Medium selection?
It is true when comparing fiber optic cable to other candidates it is not as
attractive from a cost point of view. However, the situation is getting better
year by year. In particular take a look at Figure1-15. This illustrates the
cost trends for different candidates for the Transmission Medium. Cost trends
are graphed for the period 1990 through 1995. Notice the decrease for fiber
optic cable. In the years since it has decreased even further. Of course, this is
for glass based fiber optic cable. Plastic fiber optic cable has a much lower
cost. In any case from a cost point of view fiber optic cable is and will
probably continue to be more expensive than the cheapest, voice grade,
unshielded twisted pair cable. However, its cost is merging with the other
candidates. Certainly, the really minor cost disadvantage is greatly outweighed
with the significant performance advantages.
Figure 1-15: Cost trends of common transmission media
Putting this altogether there is no argument. Fiber optic cable should be the
Transmission Medium of choice when considering data links in new facilities
where no other Transmission Medium candidate exists.
There is and will continue to be tremendous activity with respect to carrying
out data communications in the wide area network or long haul environment. This
is the environment of the long distance carrier, the Telephone Company.
However, there is even greater activity with respect to the implementation of
data links in the premises or local area environment. This is the environment
of the office building, Small Office Home Office (SOHO), the factory and the
campus. As PC's have proliferated throughout all premise type facilities the
need for data communications links has followed. Installation of premises data
links be they point-to-point, multi-point, part of a Local Area Network (LAN)
or whatever is a major agenda item for many business concerns. The case has
been made above for fiber optic cable being the Transmission Medium of choice
for these links. This is why it is the subject of interest in this book.
1.7 Program
This book
has been written so that each chapter stands on its own. There is no need to
read the chapters in order. There may be occasionally cross-references from one
chapter to another. However, the information can easily be gleaned without
going back to the very beginning.
A brief summary of the sequel is as follows:
Chapter 2 - A careful review is
given to the details of a fiber optic data link for the premise environment.
The possibilities for and properties of fiber optic cable are discussed.
Candidates for the Transmitter and Receiver are considered. Connectors and
splices are introduced. The performance of the data link is analyzed with a
careful look at the loss budget.
Chapter 3 - Consideration is given
to exploiting the large bandwidth presented by fiber optic cable to support the
data communications of multiple users - multiple Source - User pairs. That is,
how to carve out multiple fiber optic data links from a single fiber optic
cable in the premises environment. This is accomplished by multiplexing. Both
Time Division Multiplexing (TDM) and Wavelength Division Multiplexing (WDM) are
discussed.
Chapter 4 - Discussion focuses on
the Local Area Network (LAN). Fiber optic data links are joined with LAN's.
Using LAN architectures carries out a great deal of premise data communication.
The delay properties of fiber optic cable can be exploited to extend the
distance coverage of a LAN. A fiber optic data link can be used to connect
remote stations to a LAN hub. Stations that may be too far from a LAN to be
connected by a copper cable may possibly be joined by a fiber optic data link.
Chapter 5 - The manufacturing
environment is considered. In particular the environment presented by heavy
industry that always has a plethora of high (electric) powered tools in use.
The manufacturing environment presents a situation where premises data
communications may have to be carried out with intense noise and interference
present. The interference protection properties of a fiber optic data link are
considered in this environment. In particular, consideration is given to the
types of data links and networking architectures generally found in the
manufacturing environment. The discussion centers on how these links and
architectures can exploit the interference protection properties of a fiber
optic data link.
Chapter 6 - Discussion centers on
fiber optic products that can be used to serve serial data communications.
Chapter 7 - Standards that cover
the use of fiber optic data links within premises networks are enumerated.
Organization from which they can be ordered, in full, are provided.
Chapter 8 - A glossary that covers
the subject of fiber optic data communications. It provides terminology
specifically covered within this book. However, it goes further and provides
terminology that may not be used here but may be encountered within a broader
view of the interest area or within communications in general.
CHAPTER 2
THE FIBER OPTIC DATA COMMUNICATIONS LINK FOR THE PREMISES ENVIRONMENT
2.1 The
Fiber Optic Data Communications Link, End-to-End
In this chapter we consider the simple fiber optic data link for the premises
environment. This is the basic building block for a fiber optic based network.
A model of this simple link is shown in Figure 2-1.

Figure 2-1: Model of "simple" fiber optic data link
The illustration indicates the Source-User pair, Transmitter and Receiver. It
also clearly shows the fiber optic cable constituting the Transmission Medium
as well as the connectors that provide the interface of the Transmitter to the
Transmission Medium and the Transmission Medium to the Receiver.
All of these are components of the simple fiber optic data link. Each will be
discussed. Consideration will be in the following order: fiber optic cable,
Transmitter, Receiver and connectors. We will conclude by taking up the
question of how to analyze the performance of the simple fiber optic data link.
2.2 Fiber Optic Cable
We begin by asking Just what is a fiber optic cable? A fiber optic cable is a
cylindrical pipe. It may be made out of glass or plastic or a combination of
glass and plastic. It is fabricated in such a way that this pipe can guide
light from one end of it to the other.
The idea of having light guided through bent glass is not new or high tech. The
author was once informed that Leonardo DaVinci actually mentioned such a means
for guiding light in one of his notebooks. However, he has not been able to
verify this assertion. What is known for certain is that total internal
reflection of light in a beam of water - essentially guided light - was
demonstrated by the physicist John Tyndall [1820-1893] in either 1854 or 1870 -
depending upon which reference you consult. Tyndall showed that light could be
bent around a corner while it traveled through a jet of pouring water.
Using light for communications came after this. Alexander Graham Bell
[1847-1922] invented the photo-phone around 1880. Bell demonstrated that a
membrane in response to sound could modulate an optical signal, light. But,
this was a free space transmission system. The light was not guided.
Guided optical communications had to wait for the 20th century. The first
patent on guided optical communications over glass was obtained by AT &T in
1934. However, at that time there were really no materials to fabricate a glass
(or other type of transparent material) fiber optic cable with sufficiently low
attenuation to make guided optical communications practical. This had to wait
for about thirty years.
During the 1960's researchers working at a number of different academic,
industrial and government laboratories obtained a much better understanding of
the loss mechanisms in glass fiber optic cable. Between 1968 and 1970 the
attenuation of glass fiber optic cable dropped from over 1000 dB/km to less
than 20 dB/km. Corning patented its fabrication process for the cable. The
continued decrease in attenuation through the 1970's allowed practical guided
light communications using glass fiber optic cable to take off. In the late
1980's and 1990's this momentum increased with the even lower cost plastic
fiber optic cable and Plastic Clad Silica (PCS).
Basically, a fiber optic cable is composed of two concentric layers termed the
core and the cladding. These are shown on the right side of Figure 2-2. The
core and cladding have different indices of refraction with the core having n1
and the cladding n2. Light is piped through the core. A fiber optic
cable has an additional coating around the cladding called the jacket. Core,
cladding and jacket are all shown in the three dimensional view on the left
side of Figure 2-2. The jacket usually consists of one or more layers of
polymer. Its role is to protect the core and cladding from shocks that might
affect their optical or physical properties. It acts as a shock absorber. The
jacket also provides protection from abrasions, solvents and other
contaminants. The jacket does not have any optical properties that might affect
the propagation of light within the fiber optic cable.
The illustration on the left side of Figure 2-2 is somewhat simplistic. In
actuality, there may be a strength member added to the fiber optic cable so
that it can be pulled during installation.

Figure 2-2: Fiber Optic Cable, 3 dimensional view and basic cross section
This would be added just inside the jacket. There may be a buffer between the
strength member and the cladding. This protects the core and cladding from
damage and allows the fiber optic cable to be bundled with other fiber optic
cables. Neither of these is shown.
How is light guided down the fiber optic cable in the core? This occurs because
the core and cladding have different indices of refraction with the index of
the core, n1, always being greater than the index of the cladding, n2.
Figure 2-3 shows how this is employed to effect the propagation of light down
the fiber optic cable and confine it to the core.
As illustrated a light ray is injected into the fiber optic cable on the right.
If the light ray is injected and strikes the core-to-cladding interface at an
angle greater than an entity called the critical angle then it is reflected
back into the core. Since the angle of incidence is always equal to the angle
of reflection the reflected light will again be reflected. The light ray will
then continue this bouncing path down the length of the fiber optic cable. If
the light ray strikes the core-to-cladding interface at an angle less than the
critical angle then it passes into the cladding where it is attenuated very
rapidly with propagation distance.
Light can be guided down the fiber optic cable if it enters at less than the
critical angle. This angle is fixed by the indices of refraction of the core
and cladding and is given by the formula:
Qc = arc cosine (n2 /n1).
The critical angle is measured from the cylindrical axis of the core. By way of
example, if n1 = 1.446 and n2= 1.430 then a quick
computation will show that the critical angle is 8.53 degrees, a fairly small
angle.
Of course, it must be noted that a light ray enters the core from the air
outside, to the left of Figure 2-3. The refractive index of the air must be
taken into account in order to assure that a light ray in the core will be at
an angle less than the critical angle. This can be done fairly simply. The
following basic rule then applies. Suppose a light ray enters the core from the
air at an angle less than an entity called the external acceptance angle - Qext It
will be guided down the core. Here
Qext = arc sin [(n1/ n0) sin (Qc)]
with n0 being the index of refraction of air. This angle is, likewise, measured
from the cylindrical axis of the core. In the example above a computation shows
it to be 12.4 degrees - again a fairly small angle.

Figure 2-3: Propagation of a light ray down a fiber optic cable
Fiber optic data link performance is a subject that will be discussed in full
at the end of this chapter. However, let's jump the gun just a little. In
considering the performance of a fiber optic data link the network architect is
interested in the effect that the fiber optic cable has on overall link
performance. Consideration of performance comes to answering three questions:
1) How much light can be coupled into the core through the external acceptance
angle?
2) How much attenuation will a light ray experience in propagating down the
core?
3) How much time dispersion will light rays representing the same input pulse
experience in propagating down the core?
The more light that can be coupled into the core the more light will reach the
Receiver and the lower the BER. The lower the attenuation in propagating down
the core the more light reaches the Receiver and the lower the BER. The less
time dispersion realized in propagating down the core the faster the signaling
rate and the higher the end-to-end data rate from Source-to-User.
The answers to these questions depend upon many factors. The major factors are
the size of the fiber, the composition of the fiber and the mode of
propagation.
When it comes to size, fiber optic cables have exceedingly small diameters.
Figure 2-4 illustrates the cross sections of the core and cladding diameters of
four commonly used fiber optic cables. The diameter sizes shown are in microns,
10-6 m. To get some feeling for how small these sizes actually are, understand
that a human hair has a diameter of 100 microns. Fiber optic cable sizes are
usually expressed by first giving the core size followed by the cladding size.
Consequently, 50/125 indicates a core diameter of 50 microns and a cladding
diameter of 125 microns; 100/140 indicates a core diameter of 100 microns and a
cladding diameter of 140 microns. The larger the core the more light can be
coupled into it from external acceptance angle cone. However, larger diameter
cores may actually allow too much light in and too much light may cause
Receiver saturation problems. The left most cable shown in Figure 2-4, the
125/8 cable, is often found when a fiber optic data link operates with
single-mode propagation. The cable that is second from the right in Figure 2-4,
the 62.5/125 cable, is often found in a fiber optic data link that operates
with multi-mode propagation.

Figure 2-4: Typical core and cladding diameters -Sizes are in microns
When it comes to composition or material makeup fiber optic cables are of three
types: glass, plastic and Plastic Clad Silica (PCS). These three candidate
types differ with respect to attenuation and cost. We will describe these in
detail. Attenuation and cost will first be mentioned only qualitatively. Later,
toward the end of this sub-chapter the candidates will be compared
quantitatively.
By the way, attenuation is principally caused by two physical effects,
absorption and scattering. Absorption removes signal energy in the interaction
between the propagating light (photons) and molecules in the core. Scattering
redirects light out of the core to the cladding. When attenuation for a fiber
optic cable is dealt with quantitatively it is referenced for operation at a
particular optical wavelength, a window, where it is minimized.
Glass fiber optic cable has the lowest attenuation and comes at the highest
cost. A pure glass fiber optic cable has a glass core and a glass cladding.
This candidate has, by far, the most wide spread use. It has been the most
popular with link installers and it is the candidate with which installers have
the most experience. The glass employed in a fiber optic cable is ultra pure,
ultra transparent, silicon dioxide or fused quartz. One reference put this in
perspective by noting that "if seawater were as clear as this type of
fiber optic cable then you would be able to see to the bottom of the deepest
trench in the Pacific Ocean." During the glass fiber optic cable fabrication
process impurities are purposely added to the pure glass so as to obtain the
desired indices of refraction needed to guide light. Germanium or phosphorous
are added to increase the index of refraction. Boron or fluorine is added to
decrease the index of refraction. Other impurities may somehow remain in the
glass cable after fabrication. These residual impurities may increase the
attenuation by either scattering or absorbing light.
Plastic fiber optic cable has the highest attenuation, but comes at the lowest
cost. Plastic fiber optic cable has a plastic core and plastic cladding. This
fiber optic cable is quite thick. Typical dimensions are 480/500, 735/750 and
980/1000. The core generally consists of PMMA (polymethylmethacrylate) coated
with a fluropolymer. Plastic fiber optic cable was pioneered in Japan
principally for use in the automotive industry. It is just beginning to gain
attention in the premises data communications market in the United States. The
increased interest is due to two reasons. First, the higher attenuation
relative to glass may not be a serious obstacle with the short cable runs often
required in premise networks. Secondly, the cost advantage sparks interest when
network architects are faced with budget decisions. Plastic fiber optic cable
does have a problem with flammability. Because of this, it may not be
appropriate for certain environments and care has to be given when it is run
through a plenum. Otherwise, plastic fiber is considered extremely rugged with
a tight bend radius and the ability to withstand abuse.
Plastic Clad Silica (PCS) fiber optic cable has an attenuation that lies
between glass and plastic and a cost that lies between their cost as well.
Plastic Clad Silica (PCS) fiber optic cable has a glass core which is often
vitreous silica while the cladding is plastic - usually a silicone elastomer
with a lower refractive index. In 1984 the IEC standardized PCS fiber optic
cable to have the following dimensions: core 200 microns, silicone elastomer
cladding 380 microns, jacket 600 microns. PCS fabricated with a silicone
elastomer cladding suffers from three major defects. It has considerable
plasticity. This makes connector application difficult. Adhesive bonding is not
possible and it is practically insoluble in organic solvents. All of this makes
this type of fiber optic cable not particularly popular with link installers.
However, there have been some improvements in it in recent years.
When it comes to mode of propagation fiber optic cable can be one of two types,
multi-mode or single-mode. These provide different performance with respect to
both attenuation and time dispersion. The single-mode fiber optic cable
provides the better performance at, of course, a higher cost.
In order to understand the difference in these types an explanation must be
given of what is meant by mode of propagation.
Light has a dual nature and can be viewed as either a wave phenomenon or a
particle phenomenon (photons). For the present purposes consider it as a wave.
When this wave is guided down a fiber optic cable it exhibits certain modes.
These are variations in the intensity of the light, both over the cable cross
section and down the cable length. These modes are actually numbered from
lowest to highest. In a very simple sense each of these modes can be thought of
as a ray of light. Although, it should be noted that the term ray of light is a
hold over from classical physics and does not really describe the true nature
of light.
In any case, view the modes as rays of light. For a given fiber optic cable the
number of modes that exist depend upon the dimensions of the cable and the
variation of the indices of refraction of both core and cladding across the
cross section. There are three principal possibilities. These are illustrated
in Figure 2-5.
Consider the top illustration in Figure 2-5. This diagram corresponds to
multi-mode propagation with a refractive index profile that is called step
index. As can be seen the diameter of the core is fairly large relative to the
cladding. There is also a sharp discontinuity in the index of refraction as you
go from core to cladding. As a result, when light enters the fiber optic cable
on the right it propagates down toward the left in multiple rays or multiple
modes. This yields the designation multi-mode. As indicated the lowest order
mode travels straight down the center. It travels along the cylindrical axis of
the core. The higher modes represented by rays, bounce back and forth, going
down the cable to the left. The higher the mode the more bounces per unit
distance down to the left.
Over to the left of this top illustration are shown a candidate input pulse and
the resulting output pulse. Note that the output pulse is significantly
attenuated relative to the input pulse. It also suffers significant time
dispersion. The reasons for this are as follows. The higher order modes, the
bouncing rays, tend to leak into the cladding as they propagate down the fiber
optic cable. They lose some of their energy into heat. This results in an attenuated
output signal. The input pulse is split among the different rays that travel
down the fiber optic cable. The bouncing rays and the lowest order mode,
traveling down the center axis, are all traversing paths of different lengths
from input to output. Consequently, they do not all reach the right end of the
fiber optic cable at the same time. When the output pulse is constructed from
these separate ray components the result is time dispersion.

Figure 2-5: Types of mode propagation in fiber optic cable (Courtesy of AMP Incorporated)
Fiber optic cable that exhibits multi-mode propagation with a step index
profile is thereby characterized as having higher attenuation and more time
dispersion than the other propagation candidates have. However, it is also the
least costly and in the premises environment the most widely used. It is
especially attractive for link lengths up to 5 km. Usually, it has a core diameter
that ranges from 100 microns to 970 microns. It can be fabricated either from
glass, plastic or PCS.
Consider the middle illustration in Figure 2-5. This diagram corresponds to
single-mode propagation with a refractive index profile that is called step
index. As can be seen the diameter of the core is fairly small relative to the
cladding. Typically, the cladding is ten times thicker than the core. Because
of this when light enters the fiber optic cable on the right it propagates down
toward the left in just a single ray, a single-mode, and the lowest order mode.
In extremely simple terms this lowest order mode is confined to a thin cylinder
around the axis of the core. (In actuality it is a little more complex). The
higher order modes are absent. Consequently, there is no energy lost to heat by
having these modes leak into the cladding. They simply are not present. All
energy is confined to this single, lowest order, mode. Since the higher order
mode energy is not lost, attenuation is not significant. Also, since the input
signal is confined to a single ray path, that of the lowest order mode, there
is little time dispersion, only that due to propagation through the non-zero
diameter, single mode cylinder.
Single mode propagation exists only above a certain specific wavelength called
the cutoff wavelength.
To the left of this middle illustration is shown a candidate input pulse and
the resulting output pulse. Comparing the output pulse and the input pulse note
that there is little attenuation and time dispersion.
Fiber optic cable that exhibits single-mode propagation is thereby
characterized as having lower attenuation and less time dispersion than the
other propagation candidates have. Less time dispersion of course means higher
bandwidth and this is in the 50 to 100 GHz/ km range. However, single mode
fiber optic cable is also the most costly in the premises environment. For this
reason, it has been used more with Wide Area Networks than with premises data
communications. It is attractive more for link lengths go all the way up to 100
km. Nonetheless, single-mode fiber optic cable has been getting increased
attention as Local Area Networks have been extended to greater distances over
corporate campuses. The core diameter for this type of fiber optic cable is
exceedingly small ranging from 5 microns to 10 microns. The standard cladding
diameter is 125 microns.
Single-mode fiber optic cable is fabricated from glass. Because of the
thickness of the core, plastic cannot be used to fabricate single-mode fiber
optic cable. The author is unaware of PCS being used to fabricate it.
It should be noted that not all single-mode fibers use a step index profile.
Some use more complex profiles to optimize performance at a particular
wavelength.
Consider the bottom illustration in Figure 2-5. This corresponds to multi-mode
propagation with a refractive index profile that is called graded index. Here
the variation of the index of refraction is gradual as it extends out from the
axis of the core through the core to the cladding. There is no sharp
discontinuity in the indices of refraction between core and cladding. The core
here is much larger than in the single-mode step index case discussed above.
Multi-mode propagation exists with a graded index. However, as illustrated the
paths of the higher order modes are somewhat confined. They appear to follow a
series of ellipses. Because the higher mode paths are confined the attenuation
through them due to leakage is more limited than with a step index. The time
dispersion is more limited than with a step index, therefore, attenuation and
time dispersion are present, just limited.
To the left of this bottom illustration is shown a candidate input pulse and
the resulting output pulse. When comparing the output pulse and the input
pulse, note that there is some attenuation and time dispersion, but not nearly
as great as with multi-mode step index fiber optic cable.
Fiber optic cable that exhibits multi-mode propagation with a graded index
profile is thereby characterized as having attenuation and time dispersion
properties somewhere between the other two candidates. Likewise its cost is
somewhere between the other two candidates. Popular graded index fiber optic
cables have core diameters of 50, 62.5 and 85 microns. They have a cladding
diameter of 125 microns - the same as single-mode fiber optic cables. This type
of fiber optic cable is extremely popular in premise data communications
applications. In particular, the 62.5/125 fiber optic cable is the most popular
and most widely used in these applications.
Glass is generally used to fabricate multi-mode graded index fiber optic cable.
However, there has been some work at fabricating it with plastic.
The illustration Figure 2-6 provides a three dimensional view of multi-mode and
single-mode propagation down a fiber optic cable. Table 2-1 provides the
attenuation and bandwidth characteristics of the different fiber optic cable
candidates. This table is far from being all inclusive, however, the common
types are represented.

Figure 2-6: Three dimensional view, optical power in multi-mode and single-mode fibers
|
Mode |
Material |
Index
of Refraction Profile |
l microns |
Size
(microns) |
Atten.
dB/km |
Bandwidth
MHz/km |
|
Multi-mode |
Glass |
Step |
800 |
62.5/125 |
5.0 |
6 |
|
Multi-mode |
Glass |
Step |
850 |
62.5/125 |
4.0 |
6 |
|
Multi-mode |
Glass |
Graded |
850 |
62.5/125 |
3.3 |
200 |
|
Multi-mode |
Glass |
Graded |
850 |
50/125 |
2.7 |
600 |
|
Multi-mode |
Glass |
Graded |
1300 |
62.5/125 |
0.9 |
800 |
|
Multi-mode |
Glass |
Graded |
1300 |
50/125 |
0.7 |
1500 |
|
Multi-mode |
Glass |
Graded |
850 |
85/125 |
2.8 |
200 |
|
Multi-mode |
Glass |
Graded |
1300 |
85/125 |
0.7 |
400 |
|
Multi-mode |
Glass |
Graded |
1550 |
85/125 |
0.4 |
500 |
|
Multi-mode |
Glass |
Graded |
850 |
100/140 |
3.5 |
300 |
|
Multi-mode |
Glass |
Graded |
1300 |
100/140 |
1.5 |
500 |
|
Multi-mode |
Glass |
Graded |
1550 |
100/140 |
0.9 |
500 |
|
Multi-mode |
Plastic |
Step |
650 |
485/500 |
240 |
5 @ 680 |
|
Multi-mode |
Plastic |
Step |
650 |
735/750 |
230 |
5 @ 680 |
|
Multi-mode |
Plastic |
Step |
650 |
980/1000 |
220 |
5 @ 680 |
|
Multi-mode |
PCS |
Step |
790 |
200/350 |
10 |
20 |
|
Single-mode |
Glass |
Step |
650 |
3.7/80 or 125 |
10 |
600 |
|
Single-mode |
Glass |
Step |
850 |
5/80 or 125 |
2.3 |
1000 |
|
Single-mode |
Glass |
Step |
1300 |
9.3/125 |
0.5 |
* |
|
Single-mode |
Glass |
Step |
1550 |
8.1/125 |
0.2 |
* |
* Too high to measure accurately. Effectively infinite.
Table 2-1: Attenuation and Bandwidth characteristics of different fiber optic cable candidates
Figure 2-7 illustrates the variation of attenuation with wavelength taken over
an ensemble of fiber optic cable material types. The three principal windows of
operation, propagation through a cable, are indicated. These correspond to
wavelength regions where attenuation is low and matched to the ability of a
Transmitter to generate light efficiently and a Receiver to carry out
detection. The 'OH' symbols indicate that at these particular wavelengths the
presence of Hydroxyl radicals in the cable material cause a bump up in
attenuation. These radicals result from the presence of water. They enter the
fiber optic cable material through either a chemical reaction in the
manufacturing process or as humidity in the environment. The illustration
Figure 2-8 shows the variation of attenuation with wavelength for, standard,
single-mode fiber optic cable.

Figure 2-7: Attenuation vs. Wavelength

Figure 2-8: Attenuation spectrum of standard single-mode fiber
2.3 Transmitter
The Transmitter component of Figure 2-1 serves two functions. First, it must be
a source of the light coupled into the fiber optic cable. Secondly, it must
modulate this light so as to represent the binary data that it is receiving
from the Source. With the first of these functions it is merely a light emitter
or a source of light. With the second of these functions it is a valve,
generally operating by varying the intensity of the light that it is emitting
and coupling into the fiber.
Within the context of interest in this book the Source provides the data to the
Transmitter as some digital electrical signal. The Transmitter can then be
thought of as Electro-Optical (EO) transducer.
First some history. At the dawn of fiber optic data communications twenty-five
years ago, there was no such thing as a commercially available Transmitter. The
network architect putting together a fiber optic data link had to design the
Transmitter himself. Everything was customized.
The Transmitter was typically designed using discrete electrical and
Electro-optical devices. This very quickly gave way to designs based upon
hybrid modules containing integrated circuits, discrete components (resistors
and capacitors) and optical source diodes (light emitting diodes-LED's or laser
diodes). The modulation function was generally performed using separate
integrated circuits and everything was placed on the same printed circuit
board.
By the 1980's higher and higher data transmission speeds were becoming of
interest to the data link architect. The design of the Transmitter while still
generally customized became more complex to accommodate these higher speeds. A
greater part of the Transmitter was implemented using VLSI circuits and
attention was given to minimizing the number of board interconnects. Intense
research efforts were undertaken to integrate the optical source diode and the
transistor level circuits needed for modulation on a common integrated circuit
substrate, without compromising performance. At present, the Transmitter
continues to be primarily designed as a hybrid unit, containing both discrete
components and integrated circuits in a single package.
By the late 1980's commercially available Transmitter's became available. As a
result, the link design could be kept separate from the Transmitter design. The
link architect was relieved from the need to do high-speed circuit design or to
design proper bias circuits for optical diodes. The Transmitter could generally
be looked at as a black box selected to satisfy certain requirements relative
to power, wavelength, data rate, bandwidth, etc. This is where the situation remains
today.
To do a proper selection of a commercially available Transmitter you have to be
able to know what you need in order to match your other link requirements. You
have to be able to understand the differences between Transmitter candidates.
There are many. We can not begin to approach this in total.
However, we can look at this in a limited way. Transmitter candidates can be
compared on the basis of two characteristics. Transmitter candidates can be
compared on the basis of the optical source component employed and the method
of modulation.
Let us deal with the optical source component of the Transmitter first. This
has to meet a number of requirements. These are delineated below:
First, its physical dimensions must be compatible with the size of the fiber
optic cable being used. This means it must emit light in a cone with cross
sectional diameter 8-100 microns, or it can not be coupled into the fiber optic
cable.
Secondly, the optical source must be able to generate enough optical power so
that the desired BER can be met.
Thirdly, there should be high efficiency in coupling the light generated by the
optical source into the fiber optic cable.
Fourthly, the optical source should have sufficient linearity to prevent the
generation of harmonics and intermodulation distortion. If such interference is
generated it is extremely difficult to remove. This would cancel the
interference resistance benefits of the fiber optic cable.
Fifthly, the optical source must be easily modulated with an electrical signal
and must be capable of high-speed modulation-or else the bandwidth benefits of
the fiber optic cable are lost.
Finally, there are the usual requirements of small size, low weight, low cost
and high reliability. The light emitting junction diode stands out as matching
these requirements. It can be modulated at the needed speeds. The proper
selection of semiconductor materials and processing techniques results in high
optical power and efficient coupling of it to the fiber optic cable. These optical
sources are easily manufactured using standard integrated circuit processing.
This leads to low cost and high reliability.
There are two types of light emitting junction diodes that can be used as the
optical source of the Transmitter. These are the light emitting diode (LED) and
the laser diode (LD). This is not the place to discuss the physics of their
operation. LED's are simpler and generate incoherent, lower power, light. LD's
are more complex and generate coherent, higher power light. Figure 2-9 illustrates
the optical power output, P, from each of these devices as a function of the
electrical current input, I, from the modulation circuitry. As the figure
indicates the LED has a relatively linear P-I characteristic while the LD has a
strong non-linearity or threshold effect. The LD may also be prone to kinks
where the power actually decreases with increasing bandwidth.
With minor exceptions, LDs have advantages over LED's in the following ways.
- They can be modulated at very high speeds.
- They produce greater optical power.
- They have higher coupling efficiency to the fiber optic cable.
LED's have advantages over LD's because they have
- higher reliability
- better linearity
- lower cost

Figure 2-9: LED and laser diodes: P-I characteristics
Both the LED and LD generate an optical beam with such dimensions that it can
be coupled into a fiber optic cable. However, the LD produces an output beam
with much less spatial width than an LED. This gives it greater coupling
efficiency. Each can be modulated with a digital electrical signal. For very
high-speed data rates the link architect is generally driven to a Transmitter
having a LD. When cost is a major issue the link architect is generally driven
to a Transmitter having an LED.
A key difference in the optical output of an LED and a LD is the wavelength
spread over which the optical power is distributed. The spectral width, sl, is
the 3 dB optical power width (measured in nm or microns). The spectral width
impacts the effective transmitted signal bandwidth. A larger spectral width
takes up a larger portion of the fiber optic cable link bandwidth. Figure 2-10
illustrates the spectral width of the two devices. The optical power generated
by each device is the area under the curve. The spectral width is the
half-power spread. A LD will always have a smaller spectral width than a LED.
The specific value of the spectral width depends on the details of the diode
structure and the semiconductor material. However, typical values for a LED are
around 40 nm for operation at 850 nm and 80 nm at 1310 nm. Typical values for a
LD are 1 nm for operation at 850 nm and 3 nm at 1310 nm.

Figure 2-10: LED and laser spectral widths
Once a Transmitter is selected on the basis of being either an LED or a LD
additional concerns should be considered in reviewing the specifications of the
candidates. These concerns include packaging, environmental sensitivity of
device characteristics, heat sinking and reliability.
With either an LED or LD the Transmitter package must have a transparent window
to transmit light into the fiber optic cable. It may be packaged with either a
fiber optic cable pigtail or with a transparent plastic or glass window. Some
vendors supply the Transmitter with a package having a small hemispherical lens
to help focus the light into the fiber optic cable.
Packaging must also address the thermal coupling for the LED or LD. A complete
Transmitter module may consume over 1 W- significant power consumption in a
small package. Attention has to be paid to the heat sinking capabilities.
Plastic packages can be used for lower speed and lower reliability
applications. However, for high speed and high reliability look for the Transmitter
to be in a metal package with built-in fins for heat sinking.
Let us now deal with the modulator component of the Transmitter.
There are several different schemes for carrying out the modulation function.
These are respectively: Intensity Modulation, Frequency Shift Keying, Phase
Shift Keying and Polarization Modulation. Within the context of a premise fiber
optic data link the only one really employed is Intensity Modulation. This is
the only one that will be described.
Intensity Modulation also is referred to as Amplitude Shift Keying (ASK) and
On-Off Keying (OOK). This is the simplest method for modulating the carrier
generated by the optical source. The resulting modulated optical carrier is
given by:
Es(t) = Eo m(t) cos ( 2pfst )
Within the context of a premises fiber optic data link the modulating signal m
(t), the Information, assumes only the values of '0' and '1.' The parameter 'fs'
is the optical carrier frequency. This is an incoherent modulation scheme. This
means that the carrier does not have to exhibit stability. The demodulation
function in the Receiver will just be looking for the presence or absence of
energy during a bit time interval.
Intensity Modulation is employed universally for premises fiber optic data
links because it is well matched to the operation of both LED's and LD's. The
carrier that each of these sources produce is easy to modulate with this
technique. Passing current through them operates both of these devices. The
amount of power that they radiate (sometimes referred to as the radiance) is
proportional to this current. In this way the optical power takes the shape of
the input current. If the input current is the waveform m (t) representing the
binary information stream then the resulting optical signal will look like
bursts of optical signal when m (t) represents a '1' and the absence of optical
signal when m(t) represents a '0.' The situation is illustrated in Figure 2-11
and Figure 2-12. The first of these figures shows the essential Transmitter
circuitry for modulating either an LED or LD with Intensity Modulation. The
second of these figures illustrates the input current representing the
Information and the resulting optical signal generated and provided to the
fiber optic cable.

Figure 2-11: Two methods for modulating LEDs or LDs

Figure 2-12: a. Input current representing modulation waveform, m(t); b. Output optical signal representing m(t). Vertical cross hatches indicate optical carrier
It must be noted that one reason for the popularity of Intensity Modulation is
its suitability for operation with LED's. An LED can only produce incoherent
optical power. Since Intensity Modulation does not require coherence it can be
used with an LED.
2.4 Receiver
The Receiver component of Figure 2-1 serves two functions. First, it must sense
or detect the light coupled out of the fiber optic cable then convert the light
into an electrical signal. Secondly, it must demodulate this light to determine
the identity of the binary data that it represents. In total, it must detect
light and then measure the relevant Information bearing light wave parameters
in the premises fiber optic data link context intensity in order to retrieve
the Source's binary data.
Within the realm of interest in this book the fiber optic cable provides the
data to the Receiver as an optical signal. The Receiver then translates it to
its best estimates of the binary data. It then provides this data to the User
in the form of an electrical signal. The Receiver can then be thought of as an
Electro-Optical (EO) transducer.
A Receiver is generally designed with a Transmitter. Both are modules within
the same package. The very heart of the Receiver is the means for sensing the
light output of the fiber optic cable. Light is detected and then converted to
an electrical signal. The demodulation decision process is carried out on the
resulting electrical signal. The light detection is carried out by a
photodiode. This senses light and converts it into an electrical current.
However, the optical signal from the fiber optic cable and the resulting
electrical current will have small amplitudes. Consequently, the photodiode
circuitry must be followed by one or more amplification stages. There may even
be filters and equalizers to shape and improve the Information bearing
electrical signal.
All of this active circuitry in the Receiver presents a source of noise. This
is a source of noise whose origin is not the clean fiber optic cable. Yet, this
noise can affect the demodulation process.
The very heart of the Receiver is illustrated in Figure 2-13. This shows a photodiode,
bias resistor and a low noise pre-amp. The output of the pre-amp is an
electrical waveform version of the original Information out the source. To the
right of this pre-amp would be additional amplification, filters and
equalizers. All of these components may be on a single integrated circuit,
hybrid or even a printed circuit board.

Figure 2-13: Example of Receiver block diagram - first stage
The complete Receiver may incorporate a number of other functions. If the data
link is supporting synchronous communications this will include clock recovery.
Other functions may included decoding (e.g. 4B/5B encoded information), error
detection and recovery.
The complete Receiver must have high detectability, high bandwidth and low
noise. It must have high detectability so that it can detect low level optical
signals coming out of the fiber optic cable. The higher the sensitivity, the
more attenuated signals it can detect. It must have high bandwidth or fast rise
time so that it can respond fast enough and demodulate, high speed, digital
data. It must have low noise so that it does not significantly impact the BER
of the link and counter the interference resistance of the fiber optic cable
Transmission Medium.
There are two types of photodiode structures; Positive Intrinsic Negative (PIN)
and the Avalanche Photo Diode (APD). In most premises applications the PIN is
the preferred element in the Receiver. This is mainly due to fact that it can
be operated from a standard power supply, typically between 5 and 15 V. APD
devices have much better sensitivity. In fact it has 5 to 10 dB more
sensitivity. They also have twice the bandwidth. However, they cannot be used
on a 5V printed circuit board. They also require a stable power supply. This
makes cost higher. APD devices are usually found in long haul communications
links.
The demodulation performance of the Receiver is characterized by the BER that
it delivers to the User. This is determined by the modulation scheme - in
premise applications - Intensity modulation, the received optical signal power,
the noise in the Receiver and the processing bandwidth.
Considering the Receiver performance is generally characterized by a parameter
called the sensitivity, this is usually a curve indicating the minimum optical
power that the Receiver can detect versus the data rate, in order to achieve a
particular BER. The sensitivity curve varies from Receiver to Receiver. It subsumes
within it the signal-to-noise ratio parameter that generally drives all
communications link performance. The sensitivity depends upon the type of
photodiode employed and the wavelength of operation. Typical examples of
sensitivity curves are illustrated in Figure 2-14.
In examining the specification of any Receiver you need to look at the
sensitivity parameter. The curve designated Quantum Limit in Figure 2-14 is a
reference. In a sense it represent optimum performance on the part of the
photodiode in the Receiver. That is, performance where there is 100% efficiency
in converting light from the fiber optic cable into an electric current for
demodulation.

Figure 2-14: Receiver sensitivities for BER = 10-9, with different devices.
2.5 Connectors
The Connector is a mechanical device mounted on the end of a fiber optic cable,
light source, Receiver or housing. It allows it to be mated to a similar device.
The Transmitter provides the Information bearing light to the fiber optic cable
through a connector. The Receiver gets the Information bearing light from the
fiber optic cable through a connector. The connector must direct light and
collect light. It must also be easily attached and detached from equipment.
This is a key point. The connector is disconnectable. With this feature it is
different than a splice which will be discussed in the next sub-chapter.
A connector marks a place in the premises fiber optic data link where signal
power can be lost and the BER can be affected. It marks a place in the premises
fiber optic data link where reliability can be affected by a mechanical
connection.
There are many different connector types. The ones for glass fiber optic cable
are briefly described below and put in perspective. This is followed by
discussion of connectors for plastic fiber optic cable. However, it must be
noted that the ST connector is the most widely used connector for premise data
communications
Connectors to be used with glass fiber optic cable are listed below in
alphabetical order.
Biconic - One of the earliest connector types used in fiber optic data links.
It has a tapered sleeve that is fixed to the fiber optic cable. When this plug is
inserted into its receptacle the tapered end is a means for locating the fiber
optic cable in the proper position. With this connector, caps fit over the
ferrules, rest against guided rings and screw onto the threaded sleeve to
secure the connection. This connector is in little use today.
D4 - It is very similar to the FC connector with its threaded coupling, keying
and PC end finish. The main difference is its 2.0mm diameter ferrule. Designed
originally by the Nippon Electric Corp.
FC/PC - Used for single-mode fiber optic cable. It offers extremely precise
positioning of the single-mode fiber optic cable with respect to the
Transmitter's optical source emitter and the Receiver's optical detector. It
features a position locatable notch and a threaded receptacle. Once installed
the position is maintained with absolute accuracy.
SC - Used primarily with single-mode fiber optic cables. It offers low cost,
simplicity and durability. It provides for accurate alignment via its ceramic
ferrule. It is a push on-pull off connector with a locking tab.
SMA - The predecessor of the ST connector. It features a threaded cap and
housing. The use of this connector has decreased markedly in recent years being
replaced by ST and SC connectors.
ST - A keyed bayonet type similar to a BNC connector. It is used for both
multi-mode and single-mode fiber optic cables. Its use is wide spread. It has
the ability both to be inserted into and removed from a fiber optic cable both
quickly and easily. Method of location is also easy. There are two versions ST
and ST-II. These are keyed and spring loaded. They are push-in and twist types.
Photographs of several of these connectors are provided in Figure 2-15.

Figure 2-15: Common connectors for glass fiber optic cable (Courtesy of AMP Incorporated)
Plastic Fiber Optic Cable Connectors - Connectors that are exclusively used for
plastic fiber optic cable stress very low cost and easy application. Often used
in applications with no polishing or epoxy. Figure 2-16 illustrates such a
connector. Connectors for plastic fiber optic cable include both proprietary
designs and standard designs. Connectors used for glass fiber optic cable, such
as ST or SMA are also available for use with plastic fiber optic cable. As
plastic fiber optic cable gains in popularity in the data communications world
there will be undoubtedly greater standardization.
Figure 2-16: Plastic fiber optic cable connector (Illustration courtesy of AMP Incorporated)
2.6 Splicing
A splice is a device to connect one fiber optic cable to another permanently.
It is the attribute of permanence that distinguishes a splice from connectors.
Nonetheless, some vendors offer splices that can be disconnected that are not
permanent so that they can be disconnected for repairs or rearrangements. The
terminology can get confusing.
Fiber optic cables may have to be spliced together for any of a number of
reasons.
One reason is to realize a link of a particular length. The network installer
may have in his inventory several fiber optic cables but, none long enough to
satisfy the required link length. This may easily arise since cable
manufacturers offer cables in limited lengths - usually 1 to 6 km. If a link of
10 km has to be installed this can be done by splicing several together. The
installer may then satisfy the distance requirement and not have to buy a new
fiber optic cable.
Splices may be required at building entrances, wiring closets, couplers and
literally any intermediary point between Transmitter and Receiver.
At first glance you may think that splicing two fiber optic cables together is
like connecting two wires. To the contrary, the requirements for a fiber-optic
connection and a wire connection are very different.
Two copper connectors can be joined by solder or by connectors that have been
crimped or soldered to the wires. The purpose is to create an intimate contact
between the mated halves in order to have a low resistance path across a
junction. On the other hand, connecting two fiber optic cables requires precise
alignment of the mated fiber cores or spots in a single-mode fiber optic cable.
This is demanded so that nearly all of the light is coupled from one fiber
optic cable across a junction to the other fiber optic cable. Actual contact
between the fiber optic cables is not even mandatory. The need for precise
alignment creates a challenge to a designer of a splice.
There are two principal types of splices: fusion and mechanical.
Fusion splices - uses an electric arc to weld two fiber optic cables together.
The splices offer sophisticated, computer controlled alignment of fiber optic
cables to achieve losses as low as 0.05 dB. This comes at a high cost.
Mechanical-splices all share common elements. They are easily applied in the
field, require little or no tooling and offer losses of about 0.2 dB.
2.7 Analyzing Performance of a
Link
You have a tentative design for a fiber optic data link of the type that is
being dealt with in this chapter, the type illustrated in Figure 2-1. You want
to know whether this tentative design will satisfy your performance
requirements.
You characterize your performance requirements by BER. This generally depends
upon the specific Source-User application. This could be as high as 10-3
for applications like digitized voice or as low as 10-10 for
scientific data. The tendency though has been to require lower and lower BERs.
The question then is will the tentative fiber optic link design provide the
required BER? The answer to this question hinges on the sensitivity of the
Receiver that you have chosen for your fiber optic data link design. This
indicates how much received optical power must appear at the Receiver in order
to deliver the required BER.
To determine whether your tentative fiber optic link design can meet the
sensitivity you must analyze it. You must determine how much power does reach
the Receiver. This is done with a fiber optic data link power budget.
A power budget for a particular example is presented in Table 2-2 below and is
then discussed. This example corresponds to the design of a fiber optic data
link with the following attributes:
- Data Rate of 50 MBPS.
- BER of 10-9.
- Link length of 5 km (premises distances).
- Multi-mode, step index, glass fiber optic cable having dimensions 62.5/125.Transmitter uses LED at 850 nm.
- Receiver uses PIN and has sensitivity of -40 dBm at 50 MBPS.
- Fiber optic cable has 1 splice.
|
LINK
ELEMENT |
VALUE |
COMMENTS |
|
Transmitter LED output power |
3 dBm |
Specified value by vendor |
|
Source coupling loss |
-5 dB |
Accounts for reflections, area mismatch etc. |
|
Transmitter to fiber optic cable connector loss |
-1 dB |
Transmitter to fiber optic cable with ST connector. Loss accounts for misalignment |
|
Splice loss |
-0.25 dB |
Mechanical splice |
|
Fiber Optic Cable Attenuation |
-20 dB |
Line 2 of Table 2-1 applied to 5 km |
|
Fiber optic cable to receiver connector loss |
-1 dB |
Fiber optic cable to Receiver with ST connector. Loss Accounts for misalignment |
|
Optical
Power Delivered at Receiver |
-24.25
dB |
|
|
Receiver Sensitivity |
-40 dBm |
Specified in link design. Consistent with Figure 2-14 |
|
LOSS
MARGIN |
15.75
dB |
|
Table 2-2: Example Power Budget for a fiber optic data link
The entries in Table 2-2 are more or less self-explanatory. Clearly, the
optical power at the Receiver is greater than that required by the sensitivity
of the PIN to give the required BER. What is important to note is the entry
termed Loss Margin? This specifies the amount by which the received optical
power exceeds the required sensitivity. In this example it is 15.75 dB. Good
design practice requires it to be at least 10 dB. Why? Because no matter how
careful the power budget is put together, entries are always forgotten, are too
optimistic or vendor specifications are not accurate.
CHAPTER 3
EXPLOITING THE BANDWIDTH OF FIBER OPTIC CABLE-EMPLOYMENT BY MULTIPLE USERS
3.1 Sharing the Transmission
Medium
You are the network manager of a company. You have a Source-User link
requirement given to you. In response you install a premises fiber optic data
link. The situation is just like that illustrated in Figure 2-1. However, the
bandwidth required by the particular Source-User pair, the bandwidth to accommodate
the Source-User speed requirement, is much, much, less than is available from
the fiber optic data link. The tremendous bandwidth of the installed fiber
optic cable is being wasted. On the face of it, this is not an economically
efficient installation.
You would like to justify the installation of the link to the Controller of
your company, the person who reviews your budget. The Controller doesn't
understand the attenuation benefits of fiber optic cable. The Controller
doesn't understand the interference benefits of fiber optic cable. The
Controller hates waste. He just wants to see most of the bandwidth of the fiber
optic cable used not wasted. There is a solution to this problem. Don't just
dedicate the tremendous bandwidth of the fiber optic cable to a single,
particular, Source-User communication requirement. Instead, allow it to be
shared by a multiplicity of Source-User requirements. It allows it to carve a
multiplicity of fiber optic data links out of the same fiber optic cable.
The technique used to bring about this sharing of the fiber optic cable among a
multiplicity of Source-User transmission requirements is called multiplexing.
It is not particular to fiber optic cable. It occurs with any transmission
medium e.g. wire, microwave, etc., where the available bandwidth far surpasses
any individual Source-User requirement. However, multiplexing is particularly
attractive when the transmission medium is fiber optic cable. Why? Because the
tremendous bandwidth presented by fiber optic cable presents the greatest
opportunity for sharing between different Source-User pairs.
Conceptually, multiplexing is illustrated in Figure 3-1. The figure shows 'N'
Source-User pairs indexed as 1, 2, . . . There is a multiplexer provided at
each end of the fiber optic cable. The multiplexer on the left takes the data
provided by each of the Sources. It combines these data streams together and
sends the resultant stream out on the fiber optic cable. In this way the
individual Source generated data streams share the fiber optic cable. The
multiplexer on the left performs what is called a multiplexing or combining
function. The multiplexer on the right takes the combined stream put out by the
fiber optic cable. It separates the combined stream into the individual Source streams
composing it. It directs each of these component streams to the corresponding
User. The multiplexer on the right performs what is called a demultiplexing
function.
A few things should be noted about this illustration shown in Figure 3-1.
Figure 3-1: Conceptual view of Multiplexing. A single fiber optic cable is "carved" into a multiplicity of fiber optic data links.
First, the Transmitter and Receiver are still present even though they are not
shown. The Transmitter is considered part of the multiplexer on the left and
the Receiver is considered part of the multiplexer on the right.
Secondly, the Sources and Users are shown close to the multiplexer. For
multiplexing to make sense this is usually the case. The connection from
Source-to-multiplexer and multiplexer-to-User is called a tail circuit. If the
tail circuit is too long a separate data link may be needed just to bring data
from the Source to the multiplexer or from the multiplexer to the User. The
cost of this separate data link may counter any savings effected by
multiplexing.
Thirdly, the link between the multiplexer, the link in this case realized by
the fiber optic cable, is termed the composite link. This is the link where
traffic is composed of all the separate Source streams.
Finally, separate Users are shown in Figure 3-1. However, it may be that there
is just one User with separate ports and all Sources are communicating with this
common user. There may be variations upon this. The Source-User pairs need not
be all of the same type. They may be totally different types of data equipment
serving different applications and with different speed requirements.
Within the context of premise data communications a typical situation where the
need for multiplexing arises is illustrated in Figure 3-2. This shows a cluster
of terminals. In this case there are six terminals. All of these terminals are
fairly close to one another. All are at a distance from and want to communicate
with a multi-user computer. This may be either a multi-use PC or a
mini-computer. This situation may arise when all of the terminals are
co-located on the same floor of an office building and the multi-user computer
is in a computer room on another floor of the building.
The communication connection of each of these terminals could be effected by
the approach illustrated in Figure 3-3. Here each of the terminals is connected
to a dedicated port at the computer by a separate cable. The cable could be a
twisted pair cable or a fiber optic cable. Of course, six cables are required
and the bandwidth of each cable may far exceed the terminal-to-computer speed
requirements.
Figure 3-2: Terminal cluster isolated from multi-user computer
Figure 3-3: Terminals in cluster. Each connected by dedicated cables to multi-user computer
Figure 3-4: Terminals sharing a single cable to multi-user computer by multiplexing
A more economically efficient way of realizing the communication connection is
shown in Figure 3-4. Here each of the six terminals is connected to a
multiplexer. The data streams from these terminals are collected by the
multiplexer. The streams are combined and then sent on a single cable to
another multiplexer located near the multi-user computer. This second
multiplexer separates out the individual terminal data streams and provides
each to its dedicated port. The connection going from the computer to the
terminals is similarly handled. The six cables shown in Figure 3-3 has been
replaced by the single composite link cable shown in Figure 3-4. Cable cost has
been significantly reduced. Of course, this comes at the cost of two
multiplexers. Yet, if the terminals are in a cluster the tradeoff is in the
direction of a net decrease in cost.
There are two techniques for carrying out multiplexing on fiber optic cable in
the premise environment. These two techniques are Time Division Multiplexing
(TDM) and Wavelength Division Multiplexing (WDM). These techniques are
described in the sequel. Examples are introduced of specific products for
realizing these techniques. These products are readily available from Telebyte.
TDM and WDM are then compared.
3.2 Time Division Multiplexing
(TDM) with Fiber Optic Cable
With TDM a multiplicity of communication links, each for a given Source-User
pair, share the same fiber optic cable on the basis of time. The multiplexer(s)
set up a continuous sequence of time slots using clocks. The duration of the
time slots depends upon a number of different engineering design factors; most
notably the needed transmission speeds for the different links. Each
communication link is assigned a specific time slot, a TDM channel, during
which it is allowed to send its data from the Source end to the User end.
During this time slot no other link is permitted to send data. The multiplexer
at the Source end takes in data from the Sources connected to it. It then loads
the data from each Source into its corresponding TDM channel. The multiplexer
at the User end unloads the data from each channel and sends it to the
corresponding User.
As an example, the Telebyte Model 273 is a high performance four-channel, time
division multiplexer whose composite link is implemented in fiber optics. The
Model 273 will transport four full-duplex channels of asynchronous RS-232 data
over two fiber optic cables. In addition, a bi-directional control signal is
also transmitted for each of the four primary channels. The maximum rate for
all four channels is 256 KBPS, 64 KBPS each. A jumper option allows upgrading
channel 1 to 128 KBPS while reducing the total channel capacity from four to
three. As an aid to installation and verification of system performance the
Model 273 is equipped with a front panel TEST switch. The function of this
switch is to send a test pattern to the remote Model 273, which causes it to go
into loopback. A SYNC LED indicates status of the fiber optic link. Signals on
the RS-232 data lines are monitored via the four Transmit Data LED's and the
four Receive Data LED's. Power for the Model 273 is supplied by a small power
adapter. Each Model 273 is supplied with four pieces of modular cable and eight
RS-232 adapters. These adapters, four male and four female, offer users the
ability to provide any connection required by their RS-232 interfaces.
Figure 3-5: Model 273 Four channel fiber optic TDM Multiplexer with Model 272A Fiber Optic Line Driver, a copper to fiber converter.
The illustration Figure 3-6 shows an application of the Telebyte Model 273 Four
Channel Fiber Optic Multiplexer. On the right side are four (4) different data
devices. These are of different types, PCs and terminals. All of these data
devices need to communicate with a main frame computer. This is not shown but
what is shown on the left is the Front End Processor (FEP) of this main frame
computer. All communication to/from the main frame computer is through ports of
the FEP. Each data device is assigned a dedicated port at the FEP. The two
Model 273's effect the communication from/to all these devices by using just
one fiber optic cable that can be as long as 2 km.
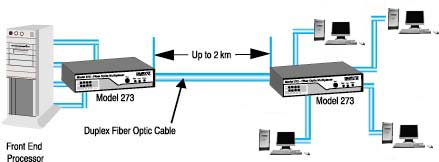
Figure 3-6: Model 273 realizing time division multiplexed data communications to a mainframe computer through its FEP.
When dealing with copper to fiber connections, an interface converter such as
the Model 272A provides the capability of performing an interface conversion
between full duplex, RS-422 signals and their equivalent for fiber optic
transmission. For applications where the transmission medium must be protected
from electrical interference, lightning, atmospheric conditions or chemical
corrosion fiber optics is the perfect solution. The Model 272A RS-422 to Fiber
Optic Line Driver handles full duplex data rates to 2.5 MBPS. The electrical
interface to the RS-422 port is fully differential for transmit and receive data
and is implemented in an industry standard DB25 connector. The fiber optic
ports are implemented using the industry standard ST connectors. The design has
been optimized for 62.5/125 micron fiber cable, however other sizes may be
used. The optical signal wavelength is approximately 850nm. The optical power
budget for the Model 272A is 12 dB. In normal applications the distance between
a pair of Model 272A's will be at least 2 km (6,600 ft). Power to operate the
Model 272A is supplied by a small, wall mounted, 9 Volt AC transformer and line
cord.
3.3 Wavelength Division
Multiplexing (WDM) With Fiber Optic Cable
With WDM a multiplicity of communication links, each for a given Source-User
pair, share the same fiber optic cable on the basis of wavelength. The data
stream from each Source is assigned an optical wavelength. The multiplexer has
within it the modulation and transmission processing circuitry. The multiplexer
modulates each data stream from each Source. After the modulation process the
resulting optical signal generated for each Source data stream is placed on its
assigned wavelength. The multiplexer then couples the totality of optical
signals generated for all Source data streams into the fiber optic cable. These
different wavelength optical signals propagate simultaneously. This is in
contrast to TDM.
The fiber optic cable is thereby carved into a multiplicity of data links -
each data link corresponding to a different one of these optical wavelengths
assigned to the Sources.
At the User end the multiplexer receives these simultaneous optical signals. It
separates these signals out according to their different wavelengths by using
prisms. This constitutes the demultiplexing operation. The separated signals
correspond to the different Source-User data streams. These are further
demodulated. The resulting separated data streams are then provided to the
respective Users.
At this point a slight digression is necessary. The focus of this book is on
premise data communications, data communications in the local area environment.
Notwithstanding, it must be mentioned that WDM has been receiving a tremendous
amount of attention within the context of Wide Area Networks (WANs). Both CATV
systems and telecommunication carriers are making greater and greater use of it
to expand the capacity of the installed WAN fiber optic cabling plant. Within
the Wide Area Networking environment the multiplicity of channels carved from a
single fiber has increased tremendously using WDM. The increase has led to the
term Dense Wavelength Division Multiplexing (DWDM) to describe the newer WDMs
employed. Now, back to our main topic.
3.4 Comparing Multiplexing
Techniques for the Premises Environment
It is best to compare TDM and WDM on the basis of link design flexibility, speed
and impact on BER.
Link Design Flexibility - TDM can be engineered to accommodate different link
types. In other words, a TDM scheme can be designed to carve a given fiber
optic cable into a multiplicity of links carrying different types of traffic
and at different transmission rates. TDM can also be engineered to have
different time slot assignment strategies. Slots may be permanently assigned.
Slots may be assigned upon demand (Demand Assignment Multiple Access - DAMA).
Slots may vary depending upon the type of link being configured. Slots may even
be dispensed with altogether with data instead being encapsulated in a packet
with Source and User addresses (statistical multiplexing). However, within the
context of premises environment there is strong anecdotal evidence that TDM
works best when it is used to configure a multiplicity of links all of the same
traffic type, with time slots all of the same duration and permanently
assigned. This simplest version of TDM is easiest to design and manage in premise
data communications. The more complex versions are really meant for the WAN
environment.
On the other hand, in the premises environment WDM, generally, has much greater
flexibility. WDM is essentially an analog technique. As a result, with WDM it
is much easier to carve a fiber optic cable into a multiplicity of links of
quite different types. The character of the traffic and the data rates can be
quite different and not pose any real difficulties for WDM. You can mix
10Base-T Ethernet LAN traffic with 100Base-T Ethernet LAN traffic with digital
video and with out of band testing signals and so on. With WDM it is much
easier to accommodate analog traffic. It is much easier to add new links on to
an existing architecture. With TDM the addition of new links with different
traffic requirements may require revisiting the design of all the time slots, a
major effort.
With respect to flexibility the one drawback that WDM has relative to TDM in
the premises environment is in the number of simultaneous links it can handle.
This is usually much smaller with WDM than with TDM. Nonetheless, advances in
DWDM for the WAN environment may filter down to the premise environment and
reverse this drawback.
Speed - Design of TDM implicitly depends upon digital components. Digital
circuitry is required to take data in from the various Sources. Digital
components are needed to store the data. Digital components are needed to load
the data into corresponding time slots, unload it and deliver it to the
respective Users. How fast must these digital components operate? Roughly, they
must operate at the speed of the composite link of the multiplexer. With a
fiber optic cable transmission medium, depending upon cable length, a composite
link of multiple GBPS could be accommodated. However, commercially available,
electrically based, digital logic speeds today are of the order of 1 billion
operations per second. This can and probably will change in the future as
device technology continues to progress. But, let us talk in terms of today.
TDM is really speed limited when it comes to fiber optic cable. It can not
provide a composite link speed to take full advantage of the tremendous
bandwidth presented by fiber optic cable. This is not just particular to the
premises environment it also applies to the WAN environment.
On the other hand, WDM does not have this speed constraint. It is an analog
technique. Its operation does not depend upon the speed of digital circuitry.
It can provide composite link speeds that are in line with the enormous
bandwidth presented by fiber optic cable.
Impact on BER - Both TDM and WDM, carve a multiplicity of links from a given
fiber optic cable. However, there may be cross talk between the links created.
This cross talk is interference that can impact the BER and affect the
performance of the application underlying the need for communication.
With TDM cross-talk arises when some of the data assigned to one time slot
slides into an adjacent time slot. How does this happen? TDM depends upon
accurate clocking. The multiplexer at the Source end depends upon time slot
boundaries being where they are supposed to be so that the correct Source data
is loaded into the correct time slot. The multiplexer at the User end depends
upon time slot boundaries being where they are supposed to be so that the
correct User gets data from the correct time slot. Accurate clocks are supposed
to indicate to the multiplexer where the time slot boundaries are. However,
clocks drift, chiefly in response to variations in environmental conditions
like temperature. What is more, the entire transmitted data streams, the
composite link, may shift small amounts back and forth in time, an effect
called jitter. This may make it difficult for the multiplexer at the User end
to place time slot boundaries accurately. Protection against TDM cross-talk is
achieved by putting guard times in the slots. Data is not packed end-to-end in
a time slot. Rather, there is either a dead space, or dummy bits or some other
mechanism built into the TDM protocol so that if data slides from one slot to
another its impact on BER is minimal.
With WDM cross-talk arises because the optical signal spectrum for a given link
placed upon one particular (center) wavelength is not bounded in wavelength
(equivalently frequency). This is a consequence of it being a physical signal
that can actually be generated. The optical signal spectrum will spill over
onto the optical signal spectrum for another link placed at another (center)
wavelength. The amount of spillage depends upon how close the wavelengths are
and how much optical filtering is built into the WDM to buffer it. The
protection against cross-talk here is measured by a parameter called isolation.
This is the attenuation (dB) of the optical signal placed at one (center) wavelength
as measured at another (center) wavelength. The greater the attenuation the
less effective spillage and the less impact on BER.
At the present time, clock stability for digital circuitry is such that TDM
cross-talk presents no real impact on BER in the context of premises data
communications and at the composite link speeds that can be accommodated. The
TDM cross-talk situation may be different when considering WANs. However, this
is the case in the premise environment. The situation is not as good for WDM.
Here, depending upon the specific WDM design, the amount of isolation may vary
from a low value of 16 dB all the way to 50 dB. A low value of isolation means
that the impact upon BER could be significant. In such situations WDM is
limited to communications applications that can tolerate a high BER. Digital
voice and video would be in this group. However, LAN traffic would not be in
this group. From the perspective of BER generated by cross-talk TDM is more
favorable than WDM.
CHAPTER 4
EXPLOITING THE DELAY PROPERTIES OF FIBER OPTIC CABLE FOR LOCAL AREA NETWORK (LAN) EXTENSION
Fiber optic cable provides a way for extending reach of Local Area Networks
(LANs). If you are well versed on the subject of LANs you are welcome to jump
right into this subject and skip the next two subchapters. However, if you have
not been initiated into LAN technology then you will find the subjects covered
in these next two subchapters worthwhile reading.
4.1 Brief History of Local Area
Networks
Two full generations ago, in the early days of the data revolution, each
computer served only a single user. In the computer room (or at that time 'the
building') of an installation there was 1 CPU, 1 keyboard, 1 card reader,
(maybe) 1 magnetic tape reader, 1 printer, 1 keypunch machine etc. From a usage
point of view this was highly inefficient. Most data processing managers were
concerned that this highly expensive equipment spent most of the time waiting
for users to employ it. Most data processing managers knew this looked bad to
the Controllers of their organizations. This led to the pioneering development
of time-sharing operating systems by MIT with Project MAC.
Time sharing opened up computational equipment to more than 1 user. Whole
departments, companies, schools etc. began making use of the expensive
computational equipment. A key element in time sharing systems concerned the
keyboard. A computer terminal replaced it. The multiple terminals were
connected to the CPU by data communications links. There was a marriage of
computation and data communications. In particular, the data communications was
mostly (though not exclusively) premises data communications.
Throughout the years time sharing led to distributed computation. The idea of
distributed computation being that applications programs would reside on one
central computer called the Server. Applications users would reside at PCs.
When an applications user wanted to run a program a copy of it would be
downloaded to him/her. In this way multiple users could work with the same
program simultaneously. This was much more efficient than the original time
sharing. Distributed computation required a data communications network to tie
the Server to the PCs and peripherals. This network was called a Local Area
Network (LAN). This network had to have high bandwidth. In fact, it had to
accommodate speeds that were orders of magnitude greater than the original time
sharing networks. Entire applications programs had to be downloaded to multiple
users. Files, the results of running applications programs, had to be uploaded
to be stored in central memory.
LANs first came on the scene in a noticeable sense in the late 1970's. From
that time until the present many flavors of LANs have been offered in the
marketplace. There are still a number of different flavors each with its group
of advocates and cult following. However, some time around the late 1980's the
market place began to recognize Ethernet as the flavor of choice. All of the
discussion in the sequel will concern only Ethernet.
The Ethernet LAN architecture had its origins in work done at Xerox Palo Alto
Research Center (PARC) by Robert Metcalf in the early 1970's. Metcalf later
went on to become the founder of 3COM. Xerox was later joined by DEC and Intel
in promoting Ethernet as the coming LAN standard. In the development of the
Ethernet LAN architecture Metcalf built upon previous research funded by the
Advanced Research Projects Agency (ARPA) at the University of Hawaii. This ARPA
program was concerned with an asynchronous multiple access data communications
technique called ALOHA.
The basic operation of an Ethernet LAN can be briefly explained with the aid of
Figure 4-1. This illustration indicates various data equipment that all need to
communicate with each other. The data equipment constitute the users of the
LAN. Each is a Source and User within the context of the discussion of Chapter
1. The location on the LAN of each data equipment unit is termed the station.

Figure 4-1: Ethernet Bus architecture
The communication between the data equipment is accomplished by having all the
data equipment tap onto a Transmission Medium. Each station taps onto the
Transmission Medium. The Transmission Medium is typically some type of cable.
As shown in Figure 4-1 it is labeled Broadcast Channel - The Ethernet Bus. The
Bus Interface Units (BIUs) provide the essential interfacing at a station
between the data equipment and the Broadcast Channel. That is, they provide the
transmit/receive capability and all needed intelligence.
It is an essential feature of the Ethernet LAN architecture that any data
equipment can transmit to any other data equipment and any data equipment can
listen to all transmissions on the Broadcast Channel, whether intended for it
or for some other data equipment user. Implicitly, the Ethernet architecture
assumes that there is no coordination in the transmissions of the different
data equipment. This is quite a bit different from the sharing of a
Transmission Medium by TDM where coordination is essential. Transmitted data
only goes in its assigned slot.
Now how does an Ethernet LAN operate? It operates by making use of three
essential items. First, it employs a Carrier Sense Multiple Access/Collision
Detection (CSMA/CD) protocol. Secondly, data to be communicated is enveloped in
packets that have the addresses of the data equipment units communicating. The
packet has the address of the equipment sending data (the origin) and the data
equipment that is the intended recipient (the destination). Thirdly, the
Ethernet Bus - the Transmission Medium - is taken as passive and supports broadcast
type transmissions. The way in which the Ethernet LAN architecture uses these
items is explained briefly below.
Consider a specific data equipment unit at its station. This will be our data
equipment unit, station and BIU of interest. For the sake of an example,
suppose it is a PC wanting to communicate with the Computer with File Server at
its station. Before attempting to transmit a data packet onto the Ethernet Bus
our terminal's BIU first listens to determine if the Bus is idle. That is, it listens
to determine if there are any other packets from other data equipment already
on the Bus. It attempts to sense the presence of a communication signal
representing a packet, a carrier, on the Bus. Our BIU and any BIU have
circuitry to perform this Carrier Sensing. An active BIU transmits its packet
on the Bus only if the Bus has been sensed as idle. In other words, it only
transmits its packet if it has determined that no other packet is already on
the Bus - carrier is absent. If the Bus is sensed as busy- carrier is present-
then the BIU defers its transmission until the Bus is sensed as idle again.
This procedure allows the various data equipment to operate asynchronously yet
avoid interfering with one another's communications.
However, it may be that a carrier has not sensed an existing packet is already
on the Bus. Transmission of a packet by the BIU of interest begins but there
are still problems. There are propagation delays and carrier detection
processing delays. Because of these, it may be that the packet from our PC's
BIU still interferes with, or collides with, a packet transmitted by another
equipment's BIU. This interfering packet is one that has not yet reached our
BIU by the end of the interval in which it had performed the carrier sensing. A
BIU monitors the transmission of the packet it is sending out to determine if
it does collide with another packet. To do this it makes use of the broadcast
nature of the transmission medium. A BIU can monitor what it has put on the
Ethernet Bus and also any other traffic on the Ethernet Bus. Our BIU and any
BIU has circuitry to perform Collision Detection. The BIU that transmitted the
interfering packet also has circuitry to perform Collision Detection.
When both BIUs sense a collision they cease transmitting. Each BIU then waits a
random amount of time before re-transmitting - that is sensing for carrier and
transmitting the packet onto the bus. If another collision occurs then this
random time wait is repeated but increased. In fact, it is increased at an
exponential rate until the collision event disappears. This approach to getting
out of collisions is called exponential back off.
4.2 Transmission Media Used To
Implement An Ethernet LAN
Let us direct attention now to the Transmission Medium that is used to
implement the Broadcast Channel, the Ethernet Bus.
Early implementations of Ethernet LANs employed thick coaxial cable. Actually,
it was thick yellow coaxial cable - the original recipe Ethernet cable. The
cable was defined by the 10Base-5 standard. This implementation was called
Thicknet. It could deliver a BER of 10-8. It supported a data rate
of 10 MBPS. The maximum LAN cable segment length was 500 meters. The segment
length is the maximum distance between data terminal equipment stations. These
are attractive features.
Unfortunately, the thick coaxial cable was difficult to work with. As a result,
second wave implementations of Ethernet LANs employed thin coaxial cable. The
cable was RG58 A/U coaxial cable - sometimes called Cheapernet. This cable was
defined by the 10Base-2 standard. The implementation was called Thinnet. It
supported a data rate of 10 MBPS. But, it had a BER somewhat degraded relative
to Thicknet. The LAN cable segment length was reduced to the order of 185
meters.
Thinnet ultimately gave way to the replacement of coaxial cable with Unshielded
Twisted Pair cable (UTP). This came about through an interesting merging of the
Ethernet LAN architecture with another LAN flavor called StarLAN, an AT & T
idea.
StarLAN was based upon what a Telco, a phone company, normally does for
businesses that is, provide voice communications. The Transmission Medium a
Telco uses within a facility for voice communications is Unshielded Twisted
Pair cable (UTP). It provides voice communications within a facility and to the
outside world by connecting all of the phones, the handsets, through a
telephone closet or wiring closet. The distance from handset to telephone
closet is relatively limited, maybe 250 meters. The StarLAN idea was to take
this basic approach for voice and use it for a LAN. The LAN stations would be
connected through a closet. The existing UTP cable present in a facility for
voice would be used for the LAN data traffic. There would be no need to install
a new and separate Transmission Medium. Installation costs would be contained.
Unfortunately, StarLAN only supported 1 MBPS. It never got off the ground.
However, in 1990 aspects of StarLAN were taken and merged with the Ethernet LAN
architecture. This resulted in a new Ethernet LAN based upon UTP and defined by
the 10Base-T standard. It was with this UTP approach that Ethernet really took
off in the market place.
Ethernet under the 10Base-T standard has a hub and spoke architecture. This is
illustrated in Figure 4-2. The various data equipment units, the stations, are
all connected to a central point called a Multipoint Repeater or Hub. The
connections are by UTP cable. This architecture does support the Broadcast
Channel-Ethernet Bus. This occurs because all data equipment units can
broadcast to all other data equipment units through the Hub. Likewise, all data
equipment units can listen to the transmissions from all other data equipment
units as they are received via the UTP cable connection to the Hub. The Hub
takes the place of the telephone closet. The Hub may be strictly passive or it
may perform signal restoration functions.

Figure 4-2: 10Base-T hub-and-spoke architecture
The illustration Figure 4-3 indicates how the 10Base-T topology may actually
look in an office set-up at some facility. Here the data equipment units are
all PCs. One serves as the file server. The illustration shows what is usually
referred to as a 10Base-T Work Group. It may serve one specific department in a
company. By connecting together these work groups Ethernet LANs may be
extended. This is accomplished by connecting hubs using LAN network elements
called bridges, routers and switches. A description of their operation is
beyond the focus of the present discussion.

Figure 4-3: Ethernet operating as a 10Base-T work group
But, let us get back to 10Base-T. It supports a data rate of 10 MBPS. It has a
BER comparable to Thinnet. However, the LAN segment length is reduced even
further. With 10Base-T the LAN segment length is only 100 m - a short distance
but a distance that is tolerable for many data equipment stations in a typical
business. However, it may be too short for others. This is a place where fiber
optic cable can come to the rescue.
For the LAN market place 10Base-T was far from the last word. It led to the
development of 100Base-T - Fast Ethernet. It is also based on using UTP cable
for transmission medium. However, it supports a data rate of 100 MBPS over
cable segments of 100 m.
Fast Ethernet, itself, is not the end of the road. Vendors are starting to
promote Giga Bit Ethernet which is capable of supporting 1 GBPS. However, we
will stop at Fast Ethernet and the problem that both it and 10Base-T have - the
short cable segment of 100 m.
Before continuing it will be worthwhile to define two terms that come up in
discussing Ethernet characteristics. These are 1) Network Diameter and 2) Slot
Time.
The Network Diameter is simply the maximum end-to-end distance between data
equipment users, stations, in an Ethernet network. It is really what has been
referred to above as the cable segment. The Network Diameter is the same for
both 10Base-T and 100Base-T, 100 m.
After a BIU has begun the transmission of a packet the Slot Time is the time
interval that a BIU listens for the presence of a collision with an interfering
packet. The Slot Time cannot be infinite. It is set for both the 10Base-T and
100Base-T Ethernet architectures. It is defined for both standards as the time
duration of 512 bits. With a 10Base-T Ethernet network operating at 10 MBPS the
Slot Time translates to 51.2msec. With a 100Base-T Ethernet
network operating at 100 MBPS the Slot Time translates to 5.12msec.
4.3 Examining the Distance
Constraint
The distance constraint of an Ethernet LAN is the Network Diameter. As noted
above this is 100 m for both the 10Base-T and 100Base-T implementations. This
may not be enough for all potential users of an Ethernet LAN. Now how do you
support LAN users that are separated by more than this 100-m constraint? To
deal with this question it is important to understand where this constraint
comes from and what is driving it.
Many people believe that the Network Diameter is set strictly by the
attenuation properties of the UTP copper cable connecting data equipment to the
Hub. This is erroneous. Attenuation does affect the Network Diameter, but it is
not the dominant influence. However, if it were, you would be able to see the
immediate possibilities of improving it by using fiber optic cable rather than
UTP copper cable. The significantly less attenuation of fiber optic cable would
boost the Network Diameter. No, it is not attenuation but instead the Slot Time
that really sets the Network Diameter.
The Slot Time is related to the amount of time delay between a transmitting BIU
and the furthermost receiving BIU. The diagram showed in Figure 4-3 illustrates
the Slot Time issues to be discussed now. Here we show two data equipment users
of an Ethernet LAN - either 10Base-T or 100Base-T - it doesn't matter. These
are labeled as Data Terminal Equipment Unit A and Data Terminal Equipment Unit
B. For brevity they will be referred to as Unit A and Unit B. The BIU's are
taken as subsumed in the ovals.

Figure 4-4: 2 Stations communicating on an Ethernet Bus. Delays shown.
Suppose Unit A transmits a data packet over the Ethernet Bus to Unit B. The
transmitted data packet travels along the Ethernet Bus. It takes a time
interval of TA seconds to reach Unit B. In the meantime, Unit B has
performed carrier sensing and has determined, from its perspective, that the
Ethernet Bus is not busy and so it also begins to transmit a data packet. From
a collision detection point of view the worst case occurs when Unit B begins to
transmit its data packet just before the data packet from Unit A arrives in
front of it. Why is this worst case? When the Unit A data packet arrives at
Unit B, Unit B immediately knows that a collision has occurred and can begin
recovery operations. However, Unit A will not know that there has been any collision
problem until the data packet from Unit B arrives in front of it. This packet
from Unit B takes a time interval of TB seconds to arrive at Unit A.
Putting this together Unit A has to wait at least TA + TB
seconds before it can detect the presence/absence of a collision. There is some
additional time needed to sense the presence/absence of a collision at both
Unit A and Unit B. The collision detection processing time is denoted as TC.
For 100Base-T networks a typical value for this is 1.12 msec. The Slot Time
is the sum TA + TB + TC.
TA and TB usually can be taken as equal and denoted as t.
Putting these together brings:
t = (Slot Time- TC) / 2
The one way delay, t, is equal to the distance between Unit A and Unit B
divided by the velocity of transmission between Units A and B. The maximum
distance is of course the Network Diameter. The velocity of transmission will
be denoted by 'V.' This is the speed of an electromagnetic wave on the Ethernet
Bus. Applying these brings:
Network Diameter = (V/2)(Slot Time- TC)
The Slot Time is fixed by the 10Base-T and 100Base-T Ethernet standards. TC
is a function of BIU design. It is evident then that it is the value of V that
really drives the Network Diameter. In characterizing the Ethernet Bus you
usually deal with the inverse of V. For UTP copper cable V-1 is
approximately 8 nsec/m. Consider a 100Base-T Ethernet LAN. Applying this value
for V-1 above brings a value of 250 m for the Network Diameter. On
the face of it this is quite a bit better than the 100-m allotted for the
Network Diameter by the standard. The difference is accounted for by a number
of delay items that were excluded from the example. These were excluded in
order to bring out the principle point - the dependence of Network Diameter on
V-1. This difference is taken up by margin allotted for other
processing functions. These functions include the delay through the Hub. They
include processing delays in software at the interface between the data equipment
and its BIU. The margin is also allotted for deleterious properties of cable.
However, the essential point remains. The achievable Network Diameter is
determined by the delay through the transmission medium. The speed of V-1
through UTP copper cable results in a Network Diameter of 100 m.
Consider a fiber optic cable. Typically, the value of V-1 is 5
nsec/m for multi-mode fiber optic cable. This is almost 50% lower than for UTP
copper cable. Applying this value in the above example would bring a Network
Diameter of 400 m, quite a bit more than 250 m.
By using a fiber optic cable you can connect data equipment stations to the LAN
that are much further apart than the 100 m distance allowed for by the assumed
UTP copper cable in 10Base-T or 100Base-T LANs. You can do this because the
velocity of light through a fiber optic cable is much faster than the group
velocity of electromagnetic waves in copper cable- the speed of current in
copper cable. You can do this because the transmission delay, V-1, of
a packet traversing a fiber optic cable is about 50% lower than it is for UTP
copper cable.
How would you do it? How would you exploit a fiber optic cable to bring distant
users into a UTP copper cable based Ethernet LAN? How would you accommodate
really distant stations to a 10Base-T or 100Base-T Ethernet LAN, stations much
further than the Network Diameter?
In order to do this you need to connect them to the Hub using a fiber optic
cable. This may be either a multi-mode or single-mode fiber optic cable.
However, neither the Ethernet Hub nor the BIU at the distant data equipment
user knows anything about signaling on a fiber optic cable Transmission Medium.
So, at the Hub you need some type of equipment that will take the 10Base-T or
100Base-T packets, in their electrical format, and convert it to light to
propagate down a fiber optic cable. You need the same equipment at the distant
data equipment's BIU for transmission toward the Hub. Similarly, you need this
device to be able to take the light wave representations of a packet coming out
of the fiber optic cable and convert it to an electrical format recognizable by
the Hub or the BIU. This is called a LAN Extender.
By using a LAN Extender you get a distance benefit. In addition, on the
particular LAN link you get the other benefits available with fiber optic
cable. These include protection from ground loops, power surges and lightning.
4.4 Examples of LAN Extenders
Shown In Typical Applications
Telebyte offers a variety of LAN Extenders. These are now described.
Model 373 10Base-T to Multimode Fiber Optic
Transceiver
This unit is pictured in Figure 4-5. It extends the distance of a 10Base-T
Ethernet LAN to over 2 km. The Model 373 10Base-T to Multi-Mode Fiber Optic
Transceiver takes 10Base-T Ethernet signals and converts them to/from optical
signals that are transmitted/received from multi-mode fiber optic cable.
Figure 4-5: Model 373 10Base-T to Multi-Mode Fiber Optic Converter
The Model 373 has a group of five LED's. These indicate the presence of the
fiber optic link, traffic going back and forth in both directions, the presence
of a collision and power. The unit even includes a Link Test switch. This
assures compatibility between older and newer Ethernet adapters. It allows the
enabling/disabling of the Link Test heart beat option.
The Model 373 uses ST connectors for the fiber optic cable. It is designed for
transmission/reception over 62.5/125 multi-mode fiber optic cable. On the
10Base-T port side, it is in full compliance with the IEEE 802.3 specification.
The Model 373 is also in full compliance with the Ethernet 10Base-FL standard.
This is the standard for using multi-mode fiber optic cable to extend the
Network Diameter of a 10Base-T Ethernet LAN.
The Model 373 is illustrated in a typical application in Figure 4-6. This shows
the stations of a 10Base-T Ethernet LAN in a typical business environment. Most
of the stations of the LAN are located near one another in the same building.
This is Building A. All of the stations in Building A are within 100 m of one
another. For purposes of this example, these people at these stations may all
be in the company's Accounting Department. They can all be connected to the LAN
through the Hub located in Building using the UTP copper cable - the ordinary
building block of a 10Base-T LAN. They are all within the 100-m Network
Diameter for a UTP copper cable based 10Base-T network. However, there is one
remote station of this LAN that is not in Building A. This may be the station
of the manufacturing manager. His office is in Building B- the production
facility. Building B is located some distance away from the front office of
Building A. In fact, Building B is about 1 km away from Building A. The
manufacturing manager needs to be tied into the Accounting Department LAN so
that he can update the Controller with inventory and purchasing information.
As Figure 4-6 indicates the manufacturing manager in Building B can easily be
tied into the LAN. This is accomplished by placing a Model 373 at the Hub in
Building A. A multi-mode fiber optic cable to another Model 373 in Building B
then connects the Model 373. The second Model 373 is connected to the
manufacturing manager's work station. The pair of Model 373's and the fiber
optic cable will be completely transparent to all stations of the LAN, both the
Accounting Department stations in Building A and the remote station of the
manufacturing manager in Building B.

Figure 4-6: Model 373 shown in a typical application
Model 374 10Base-T to Single Mode Fiber Optic
Transceiver
This unit is pictured in Figure 4-7. It is the almost the same as the Model 373
except that its fiber optic components are adapted for single-mode
transmission. Because single mode fiber optic cable has much lower attenuation
this allows a significant extension of distance. In fact, the Model 374
10Base-T to Single-Mode Fiber Optic Transceiver extends the distance of a
10Base-T Ethernet LAN to over 14 km.
The ability to achieve the extended distance is due to full duplex
transmission. Full-Duplex* has one important advantage. Since there are
separate transmit and receive paths, DTE's can transmit and receive at the same
time. Collisions are therefore eliminated. Full Duplex Ethernet is a collision
free environment.
For single-mode fiber optic cable transmission there is no standard comparable
to 10Base-FL.
*Duplex operation - Transmission on a data link in both directions. Half duplex refers to such transmission, but in a time-shared mode- only one direction can transmit at a time. With full duplex there can be transmission in both direction simultaneously.
Figure 4-7: Model 374 10Base-T to Single Mode Fiber Optic Transceiver.
The application illustrated in Figure 4-6 also applies to the Model 374.
However, now our manufacturing manager can be located in a building as far as
14 km away from the Accounting Department and still be tied into their 10Base-T
Ethernet LAN.
The Model 375 100Base-T to Multimode Fiber Optic Transceiver
allows any two 100Base-TX compliant ports to be connected by multimode,
62.5/125 micron fiber optic cable, while assuring that collision information is
preserved and translated from one segment to the other. The operation of the
device is transparent to the network and is offered in two versions. The Model
375ST is equipped with ST fiber connectors and offers 2 Km performance.
The 100 BASE-T adapters allow full duplex, simultaneous transfer of data with a
minimum of collisions. The Model 375 extends this full duplex capability using
dual fibers, while offering flawless data transmission at 100 MBPS. The Model
375 incorporates three LED's that report if the 100 Base-T and fiber are active
and powered. The fiber optic connector is a duplex as ordered, designed for
operation at 100 MBPS for FDDI, ATM or Fast Ethernet. Power for the Model 375
is via a supplied power pack.
Figure 4-8: Model 375 100Base-T to Fiber Transceiver for Fast Ethernet
The application illustrated in Figure 4-6 applies to the Model 375. You merely
have to substitute a Fast Ethernet, 100Base-T Ethernet LAN, for the 10Base-T
Ethernet LAN and substitute a Model 375 for the Model 373.
CHAPTER 5
EXPLOITING THE ADVANTAGES OF FIBER OPTIC CABLE IN THE INDUSTRIAL ENVIRONMENT
5.1 Data
Communications in the Industrial Environment
Our attention is now drawn to the problem of data communications in the
industrial environment. This is the problem of data communications in the
manufacturing facility. It is the problem of data communications on the factory
floor or in the process control plant. Data communications in these premises
can significantly benefit by using fiber optic cable as the Transmission
Medium.
Let us begin by describing the industrial environment from a data
communications perspective.
What type of data communications is going on here? Typically, the situation is
illustrated in Figure 5-1. There is a Master Computer located somewhere in the
manufacturing facility. In the past this was usually a mini-computer.
Presently, it is either a workstation or PC. The Master Computer is
communicating with any of a number of data devices. For example, it may be
controlling automated tools and sensors. It may also be exercising control by
querying and receiving data from different monitors. These data devices are
located throughout the facility. The illustration provided by Figure 5-1 shows
a machine tool, but in actuality the number of different automated tool types,
sensors and monitors may be very large. By way of example, it may extend to
well over 100 in a semiconductor fabrication facility.
The control procedure exercised by the Master Computer usually consists of
sending a message out and receiving a message back. It may be sending automated
tool or sensor an instruction. It may then receive back either an
acknowledgement of instruction receipt or a status update of some sort. In like
manner, the Master Computer may send queries to a monitor and receive back
status updates.
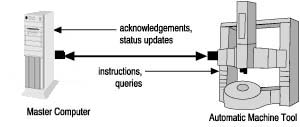
Figure 5-1: Data Communications in the industrial environment
As is readily evident, the whole control procedure is executed using data
communications with appropriate signaling devices (modems) and other needed
equipment located at both the Master Computer and the data device locations.
Required data transmission rates need not be significantly large. On the other
hand, in the industrial environment reliability requirements are quite
stringent. This is so regardless of whether reliability is measured by either
BER or link up-time or some other parameter. The consequences of an unreliable
data communications link may be a mere annoyance when it comes to office
communications. However, consequences may be catastrophic in a manufacturing
operation. Literally, an unreliable link could close down a whole plant.
Generally, the type of situation described above leads the data communications
in the industrial environment to follow an inherently hierarchical
architecture. This type of architecture is shown in Figure 5-2. The Master
Computer is located near a communications closet. The modems and/or other
communications equipment (e.g., surge suppressors, isolators, interface
converters) needed by the Master Computer to effect links to the data devices
are usually rack-mounted in a card cage placed in the communications closet.
Cabling then extends out from the card cage to the individual data devices. At
the data device end the matching communications equipment may either be
stand-alone or DIN Rail mounted. With the latter, the communications equipment
snap onto a rail mounted on a wall or mounted on some convenient cabinet near
the data device. DIN Rail mounting will be discussed in greater detail toward
the end of this chapter.
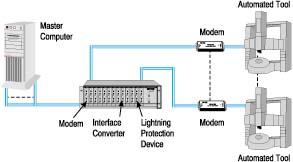
Figure 5-2: Data communications architecture usually found in the industrial environment
It is important to note that this is the general case not the absolute case. If
the Master Computer has just 1 or a few ports there may be no need for a card
cage. All data communications equipment may then be of the stand-alone type.
There are several topologies associated with this type of hierarchical
architecture. The topology could be a star with a cable extending out from the
card cage hub to each data device. Each ray of the star is simultaneously
operating as data communications link. The topology could be a multi-dropped
daisy chain, using the RS-485 interface standard. This is particularly suited
to a polling, query-response, data communications scheme - the type of
communications being carried out by the Master Computer. The topology could
even be a broadcast bus, the type used by an Ethernet LAN.
5.2 The Problem of Interference
In considering data communications in the industrial environment a key concern
is the problem of interference. This is an underlying concern regardless of
whether or not the architecture is hierarchical or not and regardless of what
topology is employed.
From an interference point of view the manufacturing facility represents a
stressed environment. The presence of high current equipment such as the
automated tools results in the propagation of electromagnetic pulses that
interfere with the data communications links. Proper grounding is always
difficult in the industrial environment. Ground loops and resulting ground
currents can cause transmitted data to be demodulated in error.
In the past, UTP copper cable was the transmission medium of choice for the
industrial environment. Why? Principally, because of there was a lot of
experience in dealing with it. There are a number of different ways of handling
the problem of intense interference when UTP copper cable is employed in this
environment. Sponges can be inserted into a data communications link to protect
against surges. Isolators can be inserted into a data communications link to
protect against ground loops. Single ended serial communications can be
replaced with serial communications employing differential signaling based upon
the RS-422 standard. Differential signaling, with sufficient balance, allows
electromagnetic interference of the type prevalent on the factory floor, to
cancel itself during the data communications reception.
But what about fiber optic cable as the Transmission Medium, doesn't this have
great interference protection? Good point! If fiber optic cable is employed in
the industrial environment concerns about interference can vanish. This
Transmission Medium is simply not affected by the electromagnetic interference
plaguing the factory floor. Furthermore, there is a side benefit. It was
mentioned that data transmission rate requirements are usually modest. However,
this may not always be so. Using fiber optic cable eliminates the concern about
future bandwidth needs.
Fiber optic cable as a Transmission Medium has been slow in coming to the
industrial environment. This has been principally due to cost. However, this is
changing as the price of fiber optic cable steadily decreases.
There are two possible ways by which fiber optic cable based data
communications may be introduced into a given manufacturing facility. In the
first way, a fiber optic cable based network may be introduced from the ground
up. In other words, it is installed where no network previously existed in the
facility. In the second way, fiber optic cabling may be patched into a network
already installed, a pre-existing network that was based on UTP copper cable.
Today, if you are considering installing a network from the ground up then you
are talking about installing an Ethernet LAN with a fiber optic cable
Transmission Medium. In the past, token ring LANs were quite popular in factory
settings. They guaranteed maximum transmission delays and were matched to
polling techniques. However, lately Ethernet has come to dominate even the
industrial environment. Furthermore, there is the advantage of being able to
bridge the factory floor LAN to other Ethernet based LANs in your organization.
If you are installing fiber optic cable by patching into a pre-existing UTP
copper based network then you must deal with the different types of data
interfaces that may exist in that network. These data interfaces may include
RS-232, RS-422 and RS-485. Electrical representations of data from/to these
interfaces have to be converted to/from light pulses traveling down fiber optic
cable.
5.3 Fiber Optic Data
Communications Products that Can Help
Telebyte offers a number of different products that are well suited to
providing data communications in the industrial environment. These products are
particularly well suited to the second approach described above, the case where
a fiber optic cable capability is being patched into a previously existing UTP
copper cable network. Several of these will now be described now.
The fiber optic cable multiplexer discussed in Chapter 3 and the Ethernet LAN
Extenders discussed in Chapter 4 can be also be used to implement data
communications on the factory floor. A multiplexer can be used to allow the
Master Computer to reach to different automated tools/sensors/monitors with a
single fiber optic cable. However, the cost saving that they can realize
depends upon how the tools/sensors/monitors are clustered. The LAN Extenders
can be used to realize a total Ethernet LAN approach to the problem of data
communications in this environment.
Model 271 Fiber Optic Auto Powered Line
Driver
Figure 5-3: Model 271 Fiber Optic Auto Powered Line Driver
The Model 271 Fiber Optic Auto Powered Line Driver is a short haul modem that
employs an RS-232 data interface and transmits the data onto a fiber optic
cable. This modem provides full duplex, asynchronous, data communications
over two fiber optic cables. The length of the fiber optic cable can be up to 2
km and the data rate as high as 56 KBPS. Performance of the unit is optimized
for 62.5/125-fiber optic cable. However, the modem can also be used with fiber
optic cable having other dimensions.
The operating power for the Model 271 Fiber optic Auto Powered Line Driver is
derived from the transmit data line. This is a real convenience when an electrical
outlet is not readily available. The Model 271 is equipped with a DTE/DCE
switch that reverses pins 2 and 3 of the RS-232 connector. This allows the
modem to support terminals, printers, computers or any other RS-232 based
device. The fiber port of the unit employs ST connectors.
One application of the Model 271 is illustrated in Figure 5-4. Notice while
this application deals with the factory environment there is no card cage
shown. Rather, the application deals with the situation where there is the need
for a data communication link between a mini-computer located in the front
office of a company and a PC located on the company's factory floor. Both the
front office and the factory floor are in the same building.

Figure 5-4: Example application for the Model 271
Data communications carried out strictly in the front office may be quite
reliable over UTP copper cable. However, in this application the data link
traverses the boundary to the factory floor. Consequently, there is a need for
the extra reliability provided by fiber optic cable.
Model 272A RS-422 to Fiber Optic Converter
The Model 272A provides the capability of performing an interface conversion
between full duplex, RS-422 signals and their equivalent for fiber optic
transmission. For applications where the transmission medium must be protected
from electrical interference, lightning, atmospheric conditions or chemical
corrosion fiber optics is the perfect solution. The Model 272A RS-422 to Fiber
Optic Line Driver handles full duplex data rates to 2.5 MBPS. The electrical
interface to the RS-422 port is fully differential for transmit and receive
data and is implemented in an industry standard DB25 connector. The fiber optic
ports are implemented using the industry standard ST connectors. The design has
been optimized for 62.5/125 micron fiber cable, however other sizes may be
used. The optical signal wavelength is approximately 850nm. The optical power
budget for the Model 272A is 12 dB. In normal applications the distance between
a pair of Model 272A's will be at least 2 km (6,600 ft). Power to operate the
Model 272A is supplied by a small, wall mounted, 9 Volt AC transformer and line
cord.
Figure 5-5: Model 272A RS-422 to Fiber Optic Converter
One application of the Model 272A is illustrated in Figure 5-6. This is a
simple case of a single data communications link being required on the factory
floor. To avoid complexities there is no card cage although the extrapolation
to one is quite easy for the reader to see. The link is between a PC and an
Intelligent Machine Controller. Previously, the link was using RS-422 signaling
for protection. Consequently, the data interfaces of both the PC and the
Intelligent Machine Controller have RS-422 implemented with DB25 connectors.
The Model 272A is placed at both ends of the link and allows the data
communications to proceed using fiber optic cable with its much greater
protection from interference.
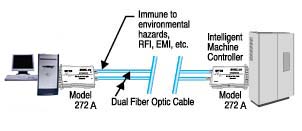
Figure 5-6: Example application for the Model 272A
Model 276A - RS-485 to Fiber Optic
Converter
The Model 276A RS-485 to Fiber Optic Line Converter accepts half-duplex data at
rates up to 1 MBPS through an RS-485 interface. It then transmits this data
onto a fiber optic cable. Likewise the unit is able to receive data from a
fiber optic cable and send it to a device through an RS-485 interface. The
RS-485 interface used by this model is balanced and implemented in a
female DB25 connector.
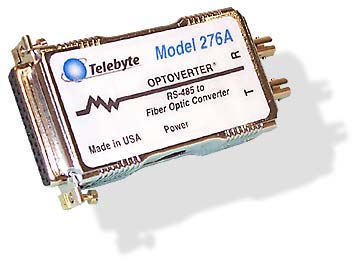
Figure 5-7: Model 276A - RS-485 Fiber Optic Converter
The network architect specifies the control of data flow in any RS-485 based
communications facility. The Model 276 RS-485 to Fiber Optic Line Driver
provides the network architect with the greatest versatility by enabling the
RS-485 transmitter when data is detected at the fiber optic receiver.
In the Model 276A RS-485 to Fiber Optic Converter the fiber optic ports are
implemented using ST connectors. Performance is optimized for fiber optic cable
having dimensions 62.5/125 and for an optical signal with an 830 nm wavelength.
However, fiber optic cable of other dimensions can be employed. The unit
provides reliable communication over a distance of 2 km.
One application of the Model 276 RS-485 to Fiber Optic Line Driver is
illustrated in Figure 5-8. This is a situation in which a PC on the factory
floor is controlling an environmental control unit and a number of different
automated tools. Control is exercised by communicating commands and receiving
responses through an RS-485 polling network. However, there is the complication
in that the PC only has an RS-232 interface. The environmental control units
and the automated tools have RS-485 interfaces. The enhanced interference
protection provided by fiber optic cable is required.
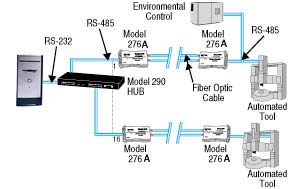
Figure 5-8: Example Application for the Model 276A
In this application the PC is connected to the Telebyte Model 290 RS-232 to RS-422/RS-485
Concentrator - Wiring Hub. This allows conversion of communications from an
RS-232 interface to a grouping of both RS-422 and RS-485 interfaces. We are
only interested in the RS-485 ports of the Model 290. Data from/to the PC is
converted and is presented on these RS-485 interfaces. Each of these interfaces
is then connected to a Model 276A RS-485 to Fiber Optic Converter. The Model
276A then sends this data out on a fiber optic cable or receives the data from
a fiber optic cable. On the far side of each of these fiber optic cables is
another Model 276A. This takes the data from the fiber optic cable and provides
it either to the environmental control unit or to one of the automated machine
tools. Likewise, it takes data from these and transmits it back along a fiber
optic cable to the PC.
Model 277 RS-232, RS-422, RS-485 to Multimode Fiber Optic Line Driver
The Model 277 Multi Interface Fiber Optic Line Driver is pictured as a
stand-alone unit in Figure 5-9. Also shown with it is the Model 8277. The Model
8277 is the same as the Model 277 except that it is DIN Rail mounted.
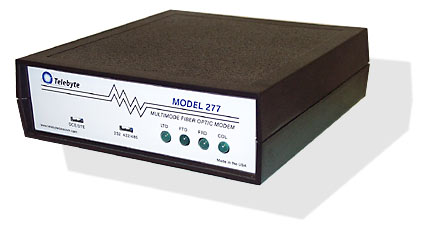
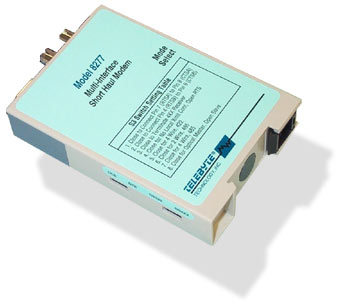
Figure 5-9: The Model 277 and the
Model 8277. Both units are the same except the Model 8277 is DIN Rail
mountable.
The Model 277 Multi Interface Fiber Optic Line Driver is a unique asynchronous
fiber optic modem. The optical interface can operate either by a point-to-point
or daisy chain ring, multi-drop, configuration. The electrical interface can
also operate in either a point-to-point or multi-drop configuration. The
network architect selects the configuration.
This unit is appropriate for factory floor networks where there is an existing
mixture of point-to-point and multi-drop, UTP copper cable based links. It can
easily convert them to fiber optic operation with the added protection this
provides.
For a point-to-point configuration, two Model 277's are connected back-to-back,
to form a high speed, full duplex, fiber optic link.
In an optical ring configuration, three or more Model 277's, in all 4-wire
modes are daisy chained in a ring. The ring will consist of a Master Model 277
and two or more slave Model 277's. Master/slave modes are switch selectable.
The slaves pass the received optical data along with the transmit data from
their own electrical interface to their optical transmitters. The Master does
not pass the received optical data. A ring of up to 10 Model 277's at a data
rate of 1 MBPS can be formed. To extend the optical distance a pair of Model
277's can be inserted into the optical interface to act as a line extender.
This unit can support fiber optic links as long as 1 mile with a transmission
rate as high as 1 MBPS. The design is optimized for transmission over
multi-mode cable at a wavelength of 850 nm.
The Model 277 electrical interface is switch selectable between RS-232, RS-422
and RS-485. As a result, this unit is well suited to assisting in the evolution
to fiber optic cable of existing UTP copper cable based factory networks.
Switch selection enables data to flow from the electrical interface the optical
transmitter or to be controlled by the Request To Send (RTS) line.
Full duplex, four wire, or half-duplex, four or two wire, may be selected when
the RS-422 or RS-485 interface is selected. The RS-422 or RS-485 interfaces of
the Model 277 may operate in a multi-dropped or point-to-point environment.
In the half duplex mode, the Model 277 controls the transmit data line on the
electrical interface.
The Model 277 is shown in an application in Figure 5-11. Here several Model
277's are being employed to extend link length past 1 mile.
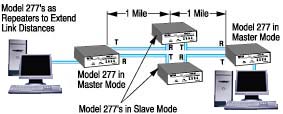
Figure 5-10: The Model 277 shown in application to extend the link length
Model 9271 RS-232 Fiber Optic Auto Powered Line Driver
Model 9271 RS-232 Fiber Optic Auto
Powered Line Driver features a standard DB9 interface for maximum
performance and reliability of data transmission over glass fiber, eliminating
the need for serial to nine-pin adapters. In addition, it brings effective data
communications to manufacturing environments. It can be installed in
applications requiring very high data transmission rates, offers resistance to
Electromagnetic Interference (EMI), and isolation from lightning-induced
current surges and ground loops. The unit employs an RS-232 data interface, can
achieve 56 kbps asynchronously and operates in either half- or full-duplex
modes over dual fibers up to 2 km in length.
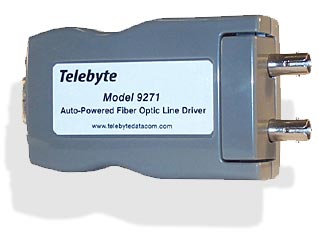
Figure 5-11: The Model 9271 Fiber Optic Auto Powered Line Driver features a standard DB9 interface
The Model
9271's ability to take/direct data from/to this interface without any
conversion eases implementation. A highly flexible solution, the Model 9271 has
been optimized for 62/125 fiber cables, and is compatible with other sizes as
well. It features industry-standard ST cable port connectors, plus a DTE/DCE
switch to reverse Pins 2 and 3 of the RS-232 connector to accommodate equipment
with different data output configurations.
Operating current for the Model 9271 is derived from the transmit data line,
with a power budget of 12 dB when using 62/125 cable. For applications
requiring a dedicated power source, the unit can be ordered with a wall-mounted
power pack (available as the Model 9271A).
The Model 9271 incorporates clips in the outer casing so that the unit can be
securely attached to a DIN rail, wall, table or desk in an organized manner.
This is an appropriate point to discuss DIN Rail mounting in greater detail.
DIN Rail mounting is a cabling system that was developed specifically for
factory automation. Only recently has it been discovered for use with data
equipment. This system is simple and straightforward. It uses a steel channel
called a DIN Rail. The DIN Rail has slotted holes for mounting and is normally
mounted in a horizontal position. DIN Rail products like the Model 9271 are
then placed on the Rail by snapping them in place after which the wiring is
completed.
CHAPTER 6
SERIAL DATA COMMUNICATIONS OVER FIBER OPTIC CABLE
In the premises environment the most common form is serial data communications.
This is the situation where data embarks from the Source at a serial interface
and enters the User at a serial interface. Serial data communications is
everywhere in the office, campus or industrial environment. It is found, on the
factory floor, in the hospital, in the retail establishment and out in the oil
patch. This list goes on and on.
In this chapter we consider premises serial data communications carried out
using fiber optic data links. Products are introduced that support this type of
communications. Some of these products have been introduced in previous
chapters. Others are new. All of these products are available from Telebyte.
Model 271 Fiber Optic Auto Powered Line
Driver
The Model 271 Fiber Optic Auto Powered Line Driver is pictured as a stand-alone
unit in Figure 6-1.
Figure 6-1: Model 271 - Fiber Optic Auto Powered Line Driver
The Model 271 Fiber Optic Auto Powered Line Driver is a short haul modem that
employs an RS-232 data interface and transmits the data on a fiber optic cable.
This modem provides, full duplex, asynchronous, data communications over two
fiber optic cables. The length of the fiber optic cable can be up to 2 km and the
data rate as high as 56 KBPS. Performance of the unit is optimized for
62.5/125-fiber optic cable. However, the modem can also be used with fiber
optic cable having other dimensions.
The operating power for the Model 271 Fiber Optic Auto Powered Line Driver is
derived from the transmit data line. This is a real convenience when an
electrical outlet is not readily available. The Model 271 is equipped with a
DTE/DCE switch that reverses pins 2 and 3 of the RS-232 connector. This allows
the modem to support terminals, printers, computers or any other RS-232 based
device. The fiber port of the unit employs ST connectors.
One application of the Model 271 is illustrated in Figure 6-2. Notice while
this application deals with the factory environment there is no card cage.
Rather, the application is dealing with the situation where there is the need
for a data communication link between a mini-computer located in the front
office of a company and a PC located on the company's factory floor. Both the
front office and the factory floor are in the same building.
Figure 6-2: Example Application of the Model 271
Data communication carried out strictly in the front office may be quite
reliable over copper cable. However, because the data communication link in
this application traverses the boundary to the factory floor there is a need
for the extra reliability provided by fiber optic cable.
Model 274 RS-232 Single Fiber, Sync/Async
Line Driver
The Model 274 RS-232 Single Fiber, Sync/Async Line Driver is pictured as a
stand-alone unit in Figure 6-3.
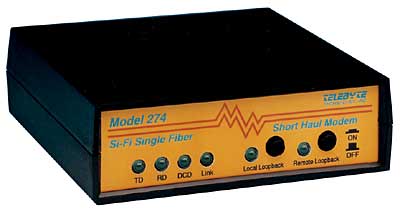
Figure 6-3: Model 274 - RS-232 Single Fiber, Sync/Async Line Driver
The Model 274 is a unique short haul modem for use on a fiber optic data link.
To achieve full duplex communication it only requires one multi-mode
62.5/125-fiber optic cable. Most fiber optic data communication networks
require two cables to achieve full duplex operation. In fact, if standard
duplex fiber optic cables have been installed the Model 274 can be used to
double the capacity.
The Model 274 receives and delivers data through an RS-232 interface. This unit
supports nine synchronous data rates up to a maximum of 256 KBPS. It supports
asynchronous data rates up to 38.4 KBPS. Furthermore, it supports two pairs of
handshake control signals, RTS/CTS and DTR/DSR.
The Model 274 has operator selectable, built-in diagnostics. These include
Local Loop-back and Remote Loop-back.
The data interface to the modem is a female DB25 connector. The fiber port
interface is a ST connector. LED's for TD, RD, control signals and loop-backs
allow the unit to assist in verifying link operation.
The four illustrations in Figure 6-4 indicate how the Model 274 may be employed
in typical applications.

Figure 6-4: The Model 274 employed in typical applications
Model 279 Multi-Mode to Single-Mode Fiber Optic Converter
The Model 279 Multi-Mode to Single-Mode Fiber Optic
Converter provides such conversion. It is pictured in Figure 6-5.
The Model 279 Multi-Mode to Single-Mode Fiber Optic Converter provides
transparent conversion between multi-mode fiber optic cable signals and
single-mode fiber optic cable signals. As alluded to above single-mode fiber
optic cable can transmit data over much longer distances than multi-mode fiber
optic cable. Single-mode operation is at a 1310 nm wavelength. Multi-mode
operation is at 850 nm wavelength.
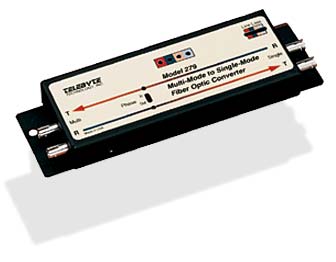
Figure 6-5: Model 279 - Multi-Mode to Single-Mode Fiber Optic Converter
There are many applications for the Model 279. This unit can be employed as an
individual converter. A pair of these units can also be employed as
single-mode, fiber optic cable, and short haul modems in order to signal over
long link distances. The unit can also be used when the optical fiber type of
the equipment is not compatible with the installed type of fiber optic cable
e.g., you have a modem transmitting multi-mode signals but the installed fiber
optic cable is single-mode.
The Model 279 operates at speeds from DC to 2.5 MBPS over links that can be as
much as 15 km long. Since operation at DC is possible there is no signal that
can be used to perform automatic gain control. However, the unit allows the
needed control, to be executed manually, by a Line Loss Switch.
The Model 279 is illustrated in one of many possible applications in Figure
6-6. This is an application in an industrial environment. There are two
manufacturing facilities in the company associated with this application. These
two facilities are remotely located from one another. They are 15 km apart. The
process control computer located on the floor of one facility needs to
communicate with the local controller in the other facility. Both the process
control computer and the local controller employ the RS-422 interface. As shown
in Figure 6-8 both the process control computer and the local controller have
data converted to fiber optic signals using the Telebyte Model 272A. However,
these signals are multi-mode. In order to cover the large 15 km distance
between the two facilities single-mode fiber optic cable must be employed.
Placing a Model 279 at the fiber output of each Model 272A allows the
conversion to the needed single-mode signals.

Figure 6-6: Model 279 shown in an application where process control computer is quite remote for a Local Controller
CHAPTER 7
STANDARDS
Any network architecture must follow some set of protocols. On the one hand,
the set of protocols may be home grown - that is specified by the designer of
the network. On the other hand, the set of protocols may conform to a
recognized, published, set of standards.
With respect fiber optic data communications in the premises environment there
are three recognized, published, sets of standards; 1) Ethernet, 100Base-FX, 2)
Fiber Distributed Data Interface, FDDI and 3) Fiber Channel.
A discussion of these published standards is well beyond the present work.
However, the interested reader may order them from a number of different
sources. Several are listed (alphabetically) below. When calling these
organizations it will be worth your while to request a catalog and request to
be included on their update services. This will allow you to be kept informed
of new standards and supplements to existing ones as they are approved.
|
ANSI |
Sales Department |
|
|
American National Standards Institute |
|
|
11 West 42nd Street, 13th Floor |
|
|
New York, NY 10036 |
|
|
Tel: (212) 642-4900 |
|
|
Fax: (212) 302-1286 |
|
EIA |
Electronic Industries Association |
|
|
2500 Wilson Blvd. |
|
|
Arlington, VA 22201 |
|
|
Tel: (703) 907-7500 |
|
|
Fax: (703) 907-7501 |
|
Global |
15 Inverness Way East |
|
Engineering |
Englewood, CO 80112-5704 |
|
|
Tel: (800) 624-3974 |
|
|
Tel: (303) 792-2181 |
|
|
Fax: (303) 790-0730 |
|
IEEE |
IEEE Customer Service |
|
|
445 Hoes Lane, PO Box 1331 |
|
|
Piscataway, NJ 08855-1331 |
|
|
Tel: (800) 678-4333 |
|
|
Tel: (908) 562-1393 |
|
|
Fax: (908) 981-9667 |
CHAPTER 8
GLOSSARY
A | B | C | D | E | F | G | H | I | J | K | L | M | N | O | P | Q | R | S | T | U | V | W
Absorption - Loss of
power in a fiber optic cable resulting from conversion of optical power into
heat. This is principally caused by impurities, such as transition metals and
hydroxyl ions. It is also caused by exposure to nuclear radiation.
Acceptance angle - The half angle
of the cone which incident light is totally, internally, reflected by the fiber
core. It is the angle over which the core of an optical fiber accepts incoming
light, usually measured from the fiber axis. It is equal to the arcsine (NA)
where NA is the numerical aperture.
Active area - The area of a
detector with greatest response.
AM - Amplitude Modulation.
Amplitude Modulation - A
transmission technique in which the amplitude of a carrier is varied in
sympathy with the information being communicated.
Analog - A format that uses
continuous physical parameters to transmit information. Examples of parameters
are voltage amplitude and carrier frequency.
Angle of deviation - In ray optic
theory it is the net resultant angular deflection experienced by a light ray
after one or more reflections or refraction's. The term is used in reference to
prisms with air interfaces. The angle of deviation is the angle between the
original incident ray and the emergent ray.
Angle of incidence - In ray optic
theory it is the angle between an incident ray and the normal to a reflecting
or refracting surface.
Angular misalignment loss - The
optical power loss caused by angular deviation from the optimum alignment of
source to optical fiber.
Angular tilt - The angle formed by
the axes of 2 fibers to be joined. Angular tilt causes an extrinsic loss that
depends upon the joining hardware and method.
APD - Avalanche photodiode.
APF - All Plastic Fiber.
Aramid yarn - Strength element
used in Siecor cable to provide support and additional protection of the fiber
optic cable bundles. Kevlar is a particular brand of Aramid yarn.
ATM - Asynchronous Transfer Mode.
This is a new emerging data standard (protocol) that uses many of the same data
rates as Fiber Channel and SONET.
Attenuation - In fiber optic
cable, attenuation results from absorption, scattering and other radiation
losses. It is usually expressed as decibels per kilometer (dB/km) without the
negative sign. Calculations and equations involving loss show and use the
negative sign.
Attenuation-limited operation -
The condition in a fiber optic cable based communications link when operation
is limited by the power of the receive signal, rather than by bandwidth or by
distortion.
Attenuator - A passive optical
component that intentionally reduces the optical power propagating in a fiber
optic cable.
Avalanche Photodiode (APD) - A
photodiode that exhibits internal amplification of photocurrent. It
accomplishes this by avalanche multiplication of carriers in the junction
region. As the reverse-bias voltage approaches the breakdown voltage,
electron-hole pairs created by absorbed photons acquire sufficient energy to
create additional electron-hole pairs when they collide with ions. A
multiplication or signal gain is thereby achieved.
Average power - The average level
of power in a signal that varies with time.
Axial ray - A light ray that
travels along the axis of a fiber optic cable.
Backscattering - The
return of a portion of scattered light to the input end of a fiber optic cable.
It is the scattering of light in the direction opposite to its original
direction of propagation.
Balanced - Signaling code with an
equal number of high and low states.
Bandpass - A range of wavelengths
over which a component will meet specifications.
Bandwidth - The information
capacity of a fiber optic cable. Precisely it is usually measured in GHz (1
Billion Hz). Occasionally it is idiomatically discussed in terms of the data
transmission rate- the BPS- the actual GHz bandwidth can support. In some
contexts it is expressed as MHz-km and denotes the analog bandwidth capability
of digital transitions per second that a fiber optic cable can sustain over a
1-km distance. Occasionally the bandwidth of a light source is referred to.
This is the width of the spectrum emitted.
Bandwidth-limited operation - The
condition in a fiber optic cable based communications link when bandwidth,
rather than received signal power, limits performance. This condition is
reached when the signal becomes distorted, principally by dispersion, beyond
specified limits.
Baseband - A method of
communication in which a signal is transmitted at its original frequency rather
than being impressed upon a carrier frequency.
Baud - A unit of data transmission
signaling speed - data transmission rate - equal to the number of signal
symbols per second. With binary modulation systems this is the same as the data
transmission rate in Bits Per Second. However, it is different with non-binary
modulation systems.
Beam splitter - An optical device,
such as a partially reflecting mirror, for dividing an optical beam in 2 or
more separate beams. It can be used in a fiber optic cable data link as a
directional coupler.
Bend loss - A+ form of increased
attenuation caused by allowing high order modes to radiate from the walls of a
fiber optic cable. There are 2 common types of bend losses. The first type
results when the fiber optic cable is curved through a restrictive radius or
curvature. The second type is generally referred to as microbends. It is caused
by small distortions of the fiber optic cable imposed by externally induced
perturbations as, for example, slip shod cabling techniques.
Bend radius - Radius a fiber optic
cable can bend before the risk of breakage or increase in attenuation. Also
referred to as cable bend radius.
BER - Bit Error Rate. This is the
probability that a transmitted bit is demodulated in error at the destination
receiver.
Biconic - A connector type which
has a taper sleeve which would be fixed to the fiber optic cable. When this
plug was inserted into its receptacle the tapered end was a means for locating
the fiber optic cable in the proper position. With this connector cap, fit over
the ferrules, rest against guided rings and screw onto the threaded sleeve to
secure the connection. This was one of the earliest connectors used in fiber
optic systems but is in little use at present.
Bit - A binary digit which is
generally either '0' or '1.' It is the smallest representation of information
in a communications and/or computing system.
Bit rate - The number of bits of
data transmitted per second over a communications link. This usually
represented as BPS with KBPS standing for kilo bits per second (1000 BPS) and
MBPS standing for mega bits per second (million BPS) and GBPS standing for giga
bits per second (billion BPS) etc.
Break Out cable - Same as a Fan
Out cable. This is a multiple fiber optic cables constructed in the tight
buffered design. It is designed for ease of connectorization and rugged
applications for intra-building and inter-building requirements.
Broadband - A method of
communication in which the signal is transmitted by being impressed on a higher
frequency carrier. Also the ability of a communications system to carry a
multitude of signals simultaneously. In data transmission is denotes
transmission facilities capable of handling frequencies greater than those for
high-grade voice communications. The higher frequency allows the carrying of
several simultaneous channels. Broadband infers the use of a carrier signal
rather than direct modulation, baseband.
Buffer - A protective layer over
the fiber optic cable, such as a coating, an inner jacket, or a hard tube. The
primary buffer, next to the cladding, is 250 mm in diameter. A secondary buffer of
900 mm is used
on indoor cables.
Buffer coating - A protective
layer, such as an acrylic polymer, applied over the fiber optic cable cladding.
Buffered fiber - Fiber optic cable
protected with an additional material, usually hytrel or nylon, to provide ease
in handling, connectorization and increased tensile strength.
Buffering - It is used in 2
contexts. First, it refers to a protective material extruded directly on the
fiber optic cable coating to protect it from the environment. Secondly, it
refers to extruding a tube around the coated fiber optic cable to allow
isolation of the fiber from stresses.
Buffer tube - A hard plastic tube,
having an inside diameter several times that of a fiber optic cable, that holds
1 or more fiber optic cables.
Building entrance - Terminal cable
entrance point where typically a trunk cable between buildings is terminated
and fiber is then distributed through the building.
Bundle - Many individual fiber
optic cables within a single jacket or buffer tube. Also, a group of buffered
fiber optic cables distinguished in some fashion from another group in the same
cable core.
Bus network - A network topology
in which all of the terminals are attached to a transmission medium serving as
a bus. All other terminals receive all signals transmitted from a terminal
connected to the bus.
Bus - Commonly called data bus.
The term is used to describe the physical linkage between stations on a network
sharing a common communication.
Byte - A unit of 8 bits.
Cable - Alternate
name for fiber optic cable. An assembly of optical fibers (the glass or plastic
basic waveguide) and other material providing mechanical and environmental protection
and optical insulation of the inner optical waveguide.
Cable assembly - Fiber optic cable
that has connectors installed on one or both ends. General use of these cable
assemblies includes the interconnection of multi-mode and single-mode fiber optic
cable systems and opto-electronic equipment. If connectors are attached to only
one end of the cable, it is known as a pigtail. If connectors are attached to
both ends, it is known as a jumper.
Cable bend radius - During
installation this infers that the cable is experiencing a tensile load. Free
bend infers a lower allowable bend radius since it is at a condition of no
load.
Carrier Sense Multiple Access With Collision
Detection CSMA/CD - A technique employed in Ethernet based LANs to
control the transmission channel. It assures that there is no conflict between
terminals that wish to transmit.
Center wavelength - The wavelength
of an optical source that might be considered its middle. One measure of this
is the average of the 2 wavelengths corresponding to the Full Width Half
Maximum- FWHM.
Central member - The center
component of a fiber optic cable. It serves as an anti-buckling element to
resist temperature-induced stresses. Sometimes serves as a strength element.
The central member is composed of steel; fiberglass or glass reinforced
plastic.
Central office - CO. The places
where communications common carriers terminate customer lines and locate
switching equipment that interconnects those lines. It is the lowest
hierarchical level of a TELCO backbone network. It is from the Central office
level that local loops go out to end-user customer premises equipment.
Centro-symmetrical Reflective Optics
- An optical technique in which a concave mirror is used to control coupling of
light from 1 fiber optic cable to another.
Channel - A communications path
derived from a specific transmission medium, as for example fiber optic cables.
The channel supports the end-to-end communications of an information source and
destination. Besides the transmission medium a channel needs to have a
transmitter/receiver (transceiver) and a modulator/demodulator (modem). By
multiplexing, several channels can share the same specific transmission medium.
Channel is synonymous with link. The term channel is usually employed within
the context of multiplexing- but not always.
Chromatic bandwidth - The inverse
of the Chromatic Dispersion.
Chromatic dispersion - The speed
of an optical pulse travelling down a fiber optic cable changes if the
wavelength changes. However, any practical light source has a spectral width
that is, has components at a number of different wavelengths. This results in a
pulse broadening - the time width of pulse broadens as it propagates down a
fiber optic cable. This effect is called chromatic dispersion. It can be
calculated experimentally by measuring the travel time down a fiber optic cable
of light at different wavelengths.
Cladding - A low refractive index
glass or plastic that surrounds the core of the fiber optic cable. Optical
cladding promotes total internal reflection for the propagation of light in
fiber. The cladding steers light to the core.
Cladding modes - A mode that is
confined to the cladding. Basically, a light ray that propagates down the
cladding. Attenuation is very high in the cladding. Consequently, a cladding
mode is eliminated after a few meters.
Cleaving - The controlled breaking
of a fiber so that its end surface is smooth.
Club Des Fibres Optiques Plastiques
- Club formed in France to promote Plastic Optical Fiber (POF) for a variety of
applications.
Coating - A material put on a
fiber optic cable during the drawing process to protect if from the
environment.
Coherent light or light waves -
This is light of which all parameters are predictable and correlated at any
point into time or space, particularly over an area perpendicular to the
direction of propagation or over time at a particular point in space. Simply,
coherent light usually refers to the phenomenon relating to the existence of a
correlation between the phases of the corresponding components of 2 light waves
or to the values of the phase of a given component at 2 instants in time or 2
points in space. Coherent light does not occur naturally in the Universe. It
can only be generated a laser.
Concentrator - A multi-port
repeater.
Conduit - Pipe or tubing through
which cables can be pulled or housed.
Connector - A mechanical device
mounted on the end of a fiber optic cable, light source, receiver or housing
that mates to a similar device. It allows light to be coupled, optically, into
and out of a fiber optic cable. A connector allows a fiber optic cable to be
connected or disconnected repeatedly from a device. Commonly used connectors
include FC/PC, Biconic, SC, ST, D4, and SMA 905 or 906.
Connector insertion loss - See
Insertion Loss.
Connector-induced fiber loss -
That part of the Conductor Insertion Loss, expressed in dB, due to impurities
or structural changes to the fiber optic cable by termination or handling with
the connector.
Core - The central, light
carrying, part of a fiber optic cable. It has an index of refraction higher
than that of the surrounding cladding.
Core eccentricity - A measure of
the displacement of the center of the core relative to the cladding center.
Coupler - It is used in 2 contexts.
First, it is a passive device that distributes optical power among 2 or more
ports and this can be in different ratios. Secondly, it is a multi-pod device
used to distribute optical power.
Coupling efficiency - The
efficiency of optical power transfer between 2 components.
Coupling losses - The power loss
suffered when coupling light from one optical device to another. There are
intrinsic losses (non-ideal fiber parameters) and extrinsic losses (mechanical
effects).
Coupling ratio - The percentage of
light transferred to a receiving output port with respect to the total power of
all output ports.
CPE - Customer Premises Equipment.
Critical angle - The greatest
angle of incidence for which a wave propagating in a homogeneous medium of
relatively high refractive index strikes an interface with a medium having a
lower refractive index and for which refraction in just possible. With respect
to fiber optic cabling the critical angle is therefore the smallest angle at
which a light ray will be totally reflected within the fiber and thereby guided
down the fiber - total internal reflection.
Crosstalk - The pickup in one
particular fiber optic cable of unwanted light from another fiber optic cable.
CSMA/CD - Carrier Sense Multiple
Access with Collision Detection.
CSR - Centro symmetrical
reflective optics.
Cutback - A method for measuring
the attenuation or bandwidth of a fiber optic cable by first measuring the full
length and then cutting back and measuring, again, the fiber optic cable at a
shorter length.
Cut off wavelength - For a single
mode fiber optic cable it is the wavelength above which the fiber optic cable
exhibits single mode operation.
CYTOP® - Perfluorinated
polymer trademark of Asahi Glass Co. Ltd.
Dark current - The
thermally induced current that exists in a photodiode in the absence of
incident optical power.
Data link - Transmitter with
Modulator, Transmission medium and Demodulator with Receiver that transmits
data between 2 points. When the Transmission medium is a fiber optic cable the
data link is a fiber optic data link.
Data rate - Also Data Transmission
Rate. The number of bits of information sent per second in a data
communications transmission system. It is generally expressed in Bits Per
Second, BPS. This may or may not be equal to the Baud rate.
dB - Decibel, a measure of loss or
equivalently attenuation. It is computed as a standard logarithmic unit for the
ratio of 2 powers, voltages or currents. In fiber optics the ratio is power and
defined by: dB = 10 Log10 (P1/P2).
dB loss budget - The amount of
light available to overcome the attenuation in the fiber optic data link and
still maintain BER (or equivalent) performance specifications.
dBm - Decibels below 1 mW.
dBm - Decibels
below 1mW.
Demultiplex - Separation of
channels which has been multiplexed in order to share a common transmission
medium. With respect to a fiber optic cable medium it is the process of
separating optical channels.
Detector - A device that generates
an electrical signal when illuminated by light. The electrical current is
dependent upon the amount of light received. Common detectors encountered in
fiber optic data communications are photodiodes, photodarlingtons and
phototransistors.
D4 - A connector type. It is very
similar to the FC connector with its threaded coupling, tunable keying and PC
end finish. The main difference is its 2.0-mm diameter ferrule. Designed
originally by the Nippon Electric Corp.
Diameter-mismatch loss - The loss
of power at a joint that occurs when the transmitting half has a diameter
greater than the diameter of the receiving half. The loss occurs when coupling
light from a source to a fiber optic cable, from a fiber optic cable to another
fiber optic cable or from a fiber optic cable to a detector.
Diamond connector - A type of
connector.
Dichroic filter - An optical
filter that transmits light selectively according to wavelength.
Dielectric - Non-metallic and
therefore non-conductive. Glass fiber optic cable is therefore considered
dielectric. A dielectric cable contains no metallic components.
Diffraction grating - An array of
fine, parallel, equally spaced reflecting or transmitting lines. These lines
mutually enhance the effects of diffraction to concentrate the diffracted light
in a few directions. These directions are determined by the spacing of the
lines and by the wavelength of the light.
Digital - A data format that uses
a discrete, countable and finite number of levels to transmit information.
Binary is a special case of this corresponding to 2 levels.
DIN 47256 - A connector type.
Directivity - This is also
referred to as near end crosstalk. It is the amount of power observed at a
given input port with respect to an initial input power.
Dispersion - A general term for
those phenomena that cause a broadening or spreading of light as it propagates
down a fiber optic cable. This is the major cause of bandwidth limitations with
fiber optic cable. There are 3 types of dispersion- modal, material and waveguide.
Differential optical path lengths in multi-mode fiber optic cables cause modal
dispersion. Material dispersion is caused by a differential delay of various
wavelengths of light in a waveguide material. Waveguide dispersion is caused by
light travelling in both the core and cladding materials in single-mode fiber
optic cables.
Distortion-limited operation -
Generally synonymous with bandwidth limited operation.
Dopan - Materials added to a core
of a fiber optic cable in order to change its characteristics.
Drawing - The manufacturing
process by which fiber optic cable is pulled from preforms.
Duplex cable - A 2 fiber cable
suitable for duplex (2 way) transmission.
Duplex operation - Transmission on
a data link in both directions. Half duplex refers to such transmission, but in
a time-shared mode- only one direction can transmit at a time. With full duplex
there can be transmission in both direction simultaneously.
Duty cycle - In digital
transmission, the ratio of high levels to low levels or the ratio of on time -
signal present - to total time - as averaged over many bit or Baud intervals.
EDFA - Erbium-doped
fiber amplifier.
EIA - Electronics Industries
Association. A standards association that publishes test procedures.
8B/10B encoding - A signal
modulation scheme in which either 4 bits are encoded into a 5-bit word or eight
bits are encoded into a 10-bit word. This scheme ensures that too many
consecutive zeros do not occur. It is used in ESCON and Fiber Channel.
802.3 network - A 10 MBPS CSMA/CD
bus based LAN; commonly called Ethernet.
802.5 network - A token passing
ring network operating at 4 or 16 MBPS.
EMC - Electromagnetic
compatibility
EMD - Equilibrium mode
distribution.
EMI - Electromagnetic
interference. It is any electrical or electromagnetic interference that causes
an undesirable response, degradation or failure in electronic equipment. Fiber
optic cables neither emits nor receives EMI.
Emitter - Term used for a light
source.
Encoding - A scheme to represent
digital ones and zeros through combining high and low voltage states.
End separation - The distance
between the ends of 2 joined fiber optic cables. End separation causes an
extrinsic loss that depends on the joining hardware and method.
End to End Loss - The optical loss
on an installed fiber optic cable data link path. This loss consists of the
loss due to the fiber optic cable, splices and connectors.
Equilibrium mode distribution -
The steady modal state of a multi-mode fiber optic cable in which the relative
power distribution among the modes is independent of the fiber optic cable
length.
Erbium-doped fiber amplifier - A
type of fiber optic cable that amplifies 1550 nm optical signals when pumped
with a 980-1480 nm light source.
ESCON - An IBM channel control
system based on fiber optic.
ESKA - Trade mark of plastic fiber
optic cable manufactured by Mitsubishi Rayon Corp.
ESKA GIGA - Graded index plastic
fiber optic cable manufactured by Mitsubishi Rayon Corp.
ESKA MEGA - Trade mark of plastic
fiber optic cable manufactured by Mitsubishi Rayon Corp.
Excess loss - There are 2 contexts
in which it is used. First, in a fiber optic coupler it is the optical loss
from that portion of light that does not emerge from the nominally operational
ports of the device. Secondly, it is the ratio of the total output power of a
passive component to the input power.
Extrinsic Losses - Signal loss in
transmission down fiber optic cable caused by imperfect alignment of fiber
optic cables joined by a connector or splice. Contributors to this loss include
angular misalignment, axial misalignment, end separation and end finish - any
imperfect joining caused by connector or splice.
Fall time - The time
required for the trailing edge of a pulse to fall from 90% to 10% of its amplitude.
The time required for a component to produce such a result. Turn off time.
Sometimes measured between the 80% and 20% points.
Fan Out cable - Same as a Break
Out cable. This is a multiple fiber optic cables constructed in the tight
buffered design. It is designed for ease of connectorization and rugged
applications for intra-building and inter-building requirements.
FC - A connector type. It is
utilized for single-mode fiber optic cable. It offers extremely precise
positioning of the single-mode fiber optic cable with respect to the emitter
and detector. It features a position locatable notch and a threaded receptacle.
Once installed, the position is maintained with absolute accuracy.
FC/PC - A connector type. It is
utilized for single mode cable. It offers extremely precise positioning of the
single mode cable with respect to the emitter and detector. It features a
position locatable notch and a threaded receptacle. Once installed the position
is maintained with absolute accuracy.
FDD I - Fiber Distributed Data
Interface. A very high-speed local area networking architecture based upon
fiber optic cable as the transmission medium. Many FDDI features were
incorporated into Fast Ethernet-100Base-T. FDDI has its own special type of
connector.
Ferrul - A component of a
connector that holds a fiber optic cable in place and aids in its alignment. It
is usually cylindrical in shape with a hold through the center.
Fiber - Thin filament of glass. An
optical waveguide consisting of a core and a cladding which is capable of
carrying information in the form of light.
Fiber bandwidth - The lowest
frequency at which the magnitude of the fiber transfer function decreases to a
specified fraction of the zero frequency value. Often the specified value is ½
of the value of the transfer function at zero frequency.
Fiber bundle - An assembly of
unbuffered fiber optic cables. It is usually employed as a single transmission
channel. This is in contrast to multi-fiber cables, which contain optically and
mechanically isolated fiber optic cables, each of which provides a separate
channel. Fiber bundles, which are used only to transmit light as in fiber optic
data communications, are flexible and unaligned. On the other hand, fiber
bundles which are used to transmit images may be flexible or rigid, but must
contain aligned fibers.
Fiber channel - An industry
standard specification for computer channel communications over a fiber optic
cable. It offers data transmission speeds from 132 MBPS to 1,062 MBPS and
transmission distances for 1 to 10 km
Fiber loss - The attenuation
(deterioration) of the light signal in transmission through a fiber optic
cable.
Fiber Distributed Data Interface network
- A token passing ring network designed specifically for fiber optic cable and
featuring dual counter-rotating rings and 100 MBPS operation.
Fiber optic interrepeater link -
Standard defining a fiber optic cable link between 2 repeaters in an IEEE 802.3
network.
Fiber optic link - Any
transmission channel using a fiber optic cable as the transmission medium to
connect 2 end terminals or to be connected in series with other channels.
Fiber optics - Light transmission
through optical fibers for communication or signaling.
Fiber Optic Test Procedure (FOTP)
- Standards developed and published by the Electronic Industries Association
(EIA) under the EIA's RS-455 series of standards.
Fiber optic waveguide - A
relatively long strand of transparent substance, usually glass, capable of
conducting an electromagnetic wave of optical wavelength (visible or near
visible region of the frequency spectrum) with some ability to confine
longitudinally directed, or near longitudinally directed, lightwaves to its
interior by means of internal reflection. The fiber optic waveguide may be
homogeneous or radically inhomogeneous with step or graded changes in its
refractive index. The indices are lower at the outer regions and the core is
thus of an increased refractive index.
FITL - Fiber in the loop.
FM - Frequency modulation.
FO7 - Plastic fiber optic cable
connector standardized in Japan.
FOIRL - Fiber optic interrepeater
link.
FOTS - Fiber optic transmission
system.
F4B/5B Encoding - A signal
modulation scheme in which groups of 4 bits are encoded and transmitted in 5
bits in order to guarantee that no more than 3 consecutive zeros ever occur. It
is used in FDDI.
FP-LD - Fabry-Perot laser diode.
Frequency modulation - A
transmission technique in which the frequency of a carrier is varied in
sympathy with the information being communicated.
Fresnel reflection - The
reflection that occurs at the planar junction of 2 materials having different
refractive indices. Fresnel reflection is not a function of the angle of
incidence.
Fresnel reflection loss - Loss of
optical power due to Fresnel reflections.
Fundamental mode - The lowest
order propagation mode of a waveguide.
Fused coupler - A method of making
a multi-mode or single-mode coupler by wrapping fiber optic cables together,
heating them and pulling them to form a central unified mass. By doing this
light on any input fiber optic cable is coupled to all out put fiber optic
cables.
Fusion splicing - A permanent
joint accomplished by the application of localized heat sufficient to fuse or
melt the ends of the fiber optic cable. This process forms a single continuous
fiber optic cable.
Fusion splice - A joining of 2
fiber optic cables by physically fusing through heat the 2 fiber optic cable
ends.
FWHM - Full width at half maximum.
This is used to describe the width of a spectral emission.
Gap loss - The
optical power loss caused by a space between axially aligned fiber optic
cables. For waveguide-to-waveguide coupling, it is commonly called longitudinal
offset loss.
GBPS - Giga Bits Per Second - 1
Billion Bits Per Second.
GHz. - Giga Hertz, 1 Billion Hz.
GI - Graded indexes.
GI-POF - Graded index plastic
fiber optic cable.
GOF - Glass Optical Fiber.
Graded index fiber - A fiber optic
cable where the core has a non-uniform index of refraction. The core is
composed of concentric rings of glass where the refractive indices decrease
from the center axis. The purpose is to reduce modal dispersion and thereby
decrease fiber bandwidth.
Graded index profile - Any
refractive index profile that varies with radius in the core.
GRIN - Graded indexes.
Ground loop noise - Noise that
results when equipment is grounded at ground points having different
potentials. This creates an unintended current path. The dielectric of fiber
optic cables provides electrical isolation that eliminates ground loops.
Hard clad silica - A
fiber optic cable with a hard plastic cladding surrounding a silica glass core.
Hertz - A unit of frequency equal
to 1 cycle per second.
Hot plate - Heat source used to
produce a mirror finish on the end of a plastic fiber optic cable.
HSPN - High Speed Plastic Network-
a program funded by the US Government to promote plastic fiber optic cabling
components and applications.
Hybrid adapter - Device that
connects various connector types.
Hybrid cable - A cable composed of
both a fiber optic cable and electrical conductors. Synonym for composite
cable.
IDP - Integrated
detector/amplifier.
IEC - International Electrical
Commission.
IEEE - Institute of Electrical and
Electronics Engineers.
Incident angle - The angle between
an incident ray and a line perpendicular to an optical surface.
Index matching material - A
material used at an optical interconnection. It has a refractive index close to
that of the fiber optic cable core and is used to reduce Fresnel reflections.
Index of refraction - The ratio of
the speed of light in a vacuum to the speed of light in a material. The symbol
for it is 'n'.
Index profile - A graded-index
fiber optic cable. In it the refractive index at a point varies with the distance
of the point from the cylindrical axis i.e. n varies with the radius.
Infrared - The designation for
electromagnetic waves at wavelengths between the visible part of the spectrum
(approximately 750 nm) and the microwave band (approximately 30 mm).
ILD - Injection Laser Diode.
Insertion loss - The loss in the
power of a signal that results from inserting a passive component into a
previously continuous path. Examples of such passive devices are connectors,
inline star couplers and splices.
Integrated detector/amplifier - A
detector package containing a pin photodiode and a transimpedence amplifier.
Interface - The debarkation point
or location on a data device where data comes out of or goes into the device.
Examples are the RS-232 interface and the Mouse-PC interface.
Intrinsic losses - Loss caused by
fiber optic cable parameter mismatches when 2 non-identical cables are joined.
Examples of such parameters are core dimensions and index profiles.
IR - Infrared.
ISDN - Integrated Services Digital
Network. A TELCO offering to allow computers to communicate through the
telephone Wide Area Network at speeds up to 128 KBPS.
ISO - International Standards
Organization. This is an independent international body formed to define
standards for multi-vendor network communications. Its 7 layer Open Systems
(OSI) reference model defines the protocol layers of network architectures
which vendors should account for in their product offerings.
Isolation - Also referred to as
far end crosstalk or far end isolation. Predominantly used in reference to WDM
products. It is a measure of light at an undesired wavelength at any given
port.
Jitney - Low cost
optical link.
Jumper Cable - Single fiber optics
cable with connectors on both ends.
Kevlar - See Aramid
yarn.
Kilo Hertz (KHz) - 1,000 Hz.
Kilometer - 1,000 meters or 3,281
feet. The kilometer is a unit of measurement in fiber optic communications.
KPSI - A unit of tensile strength
expressed in 1,000's of pounds per square inch.
LAN - Local Area
Network. This is a geographically limited data communications network. It is
often referred to as premises data communications network. Its extent is
usually limited to the office building, campus or manufacturing plant - several
1,000 feet.
Large core fiber - Usually this
refers to fiber optic cable with a core of 200 mm or more. However, sometimes
it is applied to 100/140-fiber optic cable.
Laser - An acronym for Light (by)
Amplification (by) Stimulated Emission (of ) Radiation. This is a device, which
artificially generates coherent light within a narrow range of wavelengths.
Lasers can be made to operate in a number of different ways. In one mechanism
the molecules of some material are put at higher energy levels. When light is
then incident upon the material the molecules make transitions to lower energy
levels. The correspondingly released energy is realized as coherent light.
Lasers are used as the transmitting source for fiber optic cables when
transmission distances are long. Laser light denotes light generated by a
laser.
Lateral displacement loss - The
loss of power that results from lateral displacement from optimum alignment
between 2 fiber optic cables or between a fiber optic cable and an active
device.
Launch angle - This term is used
in 4 different contexts. First, it often refers to the beam divergence of a
light source. Secondly, it refers to as the beam divergence from any emitting
surface such as an LED, laser, prism or fiber optic cable end. Thirdly, it
refers to the angle at which a light beam emerges from a surface. Fourthly, in
a fiber bundle it refers to the angle between the input radiation vector (the
chief ray of input light) and the axis of the fiber bundle. In this case if the
ends of the fiber optic cables are perpendicular to the axis of the fiber optic
cable then the launch angle is equal to the incidence angle when the ray is
external and the refraction angle when initially inside the fiber.
Launching fiber - A fiber optic
cable used in conjunction with a source to excite the modes of another fiber
optic cable in a particular way. Launching fiber optic cables are most often
used in test systems to improve the precision of measurements.
Launch Numerical Aperture (LAN) -
The numerical aperture of an optical system, which is used to couple (launch)
power into a fiber optic cable. LNA may differ from the stated NA of final
focusing element if, for example, that element is underfilled or the focus is
other than that for which the element is specified. LNA is one of the
parameters that determine the initial distribution of power among the modes of
a fiber optic cable.
Law of Reflection - Angle of
incidence = Angle of reflection.
LD - Laser diode.
LED - Light Emitting Diode.
Light - In the laser and optical
communication fields is that portion of the electromagnetic spectrum that can
be handled by the basic optical techniques used for the visible spectrum
extending from the near ultraviolet region of approximately 0.3 mm through the
visible region into the mid-infrared region of approximately 30 mm.
Light Emitting Diode - LED. A
semiconductor diode that spontaneously emits light from the pn junction when
forward current is applied.
Light piping - Use of fiber optic
cables to illuminate.
Light source - Source of light,
which is usually modulated and terminated over a fiber optic cable. It is
typically an LED or LD.
Lightguide - A fiber optic cable
or fiber bundle.
Lightguide cable - A fiber optic
cable or fiber bundle which includes a cable jacket and strength members.
Lightwaves - Electromagnetic waves
in the region of optical frequencies. The term light was originally restricted
to radiation visible with the human eye, with wavelengths between 400 and 700
nm. However, it has become customary to refer to radiation in the spectral
regions adjacent to visible light (in the near infrared from 700 to 2,000 nm)
as light in order to emphasize the physical and technical characteristics they
have in common with light.
Link - A fiber optic cable with
connectors attached to a transmitter (source) and receiver (detector).
LLDPE - Linear low density
polyethylene jacketing.
Local Area Network - See LAN.
Loose tube - A protective tube
loosely surrounding a fiber optic cable often filled with a water blocking gel.
Loss - Attenuation of optical
signal. It is usually measured in dB.
Loss budget - An accounting of
overall attenuation in a system.
Low NA - Numerical Aperture around
0.30.
LUCINA™ - Graded indexes CYTOP
fiber optic cable (GI-COF) manufactured by Asahi Glass Co.
LUMINOUS® - Trademark
of plastic fiber optic cable manufactured by Asahi Chemical.
Macro bend - A large
fiber bend that can be seen with the unaided eye.
Macrobendiing - Macroscopic axial
deviations of a fiber optic cable from a straight line, in contrast to
microbending.
MAN - Metropolitan Area Network.
This is a network linking LANs and other networks at many sites within a city
area. Dimensions are usually of the order to 10's of km.
Manchester - Balanced signaling
code, used at lower data rates.
Material dispersion - Light pulse
broadening caused by various wavelengths of light traveling at different
velocities down a fiber optic cable. Material dispersion increases with the
increasing spectral width of the source. It is attributable to the wavelength
dependence of the refractive index of the material used to form the fiber optic
cable. It is characterized by the material dispersion parameter, M (l).
Material scattering - In an
optical waveguide it is that part of the total scattering attributable to the
properties of the materials used for waveguide fabrication.
MAU- Medium Attachment Unit. This
is an active component of an Ethernet LAN connecting peripheral devices with
the electrical bus cable.
MBPS - Mega Bits Per Second - 1
million BPS.
MDPE- Medium density polyethylene
jacketing.
Mechanical splice - A splice in
which fiber optic cables are joined mechanically for example by being glued or
crimped in place. However, they are not fused together.
MFD - Mode field diameter.
MHz. - Mega Hertz, 1 million Hz.
Microbend Loss - The loss
attributed to microscopic bends in fiber optic cable.
Microbending - Curvatures of the
fiber optic cable which involves axial displacements of a few micrometers and
spatial wavelengths of a few millimeters. Micro bends cause loss of light and
consequently increase attenuation of the fiber optic cable.
Micrometer - 1 millionth of a
meter, abbreviated mm. Also referred to a micron.
Micron - See micrometer.
Misalignment loss - The loss of
power resulting from angular misalignment, lateral displacement and end -
separation.
MM - Millimeter, 1 thousandth of a
meter.
MMF - Multi-mode fiber optic
cable.
Modal bandwidth - A bandwidth
limiting mechanism in multi-mode fiber optic cables. It is also used in
single-mode fiber optic cables when operated at wavelengths below cutoff. Modal
bandwidth arises because of the different arrival times of the various modes.
It is a synonym for intermodal dispersion.
Modal dispersion - The dispersion
resulting from difference in the time it takes for different rays to traverse a
fiber optic cable.
Modal noise - The fluctuation in
optical power due to the interaction of the power traveling in more than 1
mode.
Mode coupling - The transfer of
energy between modes. In a fiber optic cable, mode coupling occurs until the
EMD is reached.
Mode field diameter - The diameter
of optical energy in a single-mode fiber optic cable. Because the MFD is
greater than the core diameter, MFD replaces the core diameter as a practical
parameter.
Mode filter - A device used to remove
high-order modes from a fiber optic cable and thereby simulate EMD.
Mode mixing - The numerous modes
of a multi-mode fiber optic cable differ in their propagating velocities. As
long as they propagate independently of each other, the fiber optic cable
bandwidth varies inversely with the fiber optic cable length due to multi-mode
distortion. As a result of inhomogeneities of the fiber optic cable geometry
and the index profile, a gradual energy exchange occurs between modes with
different velocities. Due to this mode mixing, the bandwidth of long multi-mode
fiber optic cables is greater than the value obtained by linear extrapolation
from measurements on short fiber optic cables.
Mode scrambler - A device composed
of one or more fiber optic cables in which strong mode coupling occurs.
Frequently used to provide a mode distribution that is independent of source
characteristics.
Modem - An acronym for
Modulator-Demodulator. This is a device that carries out both modulation and
demodulation. With the modulation function the modem takes information, which
is in digital form - usually, 0's and 1's, and represents it by signals, which
can be sent (transmitted) over a transmission medium. With the demodulation
function the modem takes signals out of the transmission medium (received) and
determines which digits then represent, what sequence of 0's and 1's.
Modes - In guided wave
propagation, such as that through fiber optic cable, it is the distribution of
electromagnetic energy that satisfy Maxwell's equations and boundary
conditions. Specifically, applied to optics and transmission down a fiber optic
cable a mode is loosely equivalent to a light ray of classic ray optic theory.
Sometimes used to denote a light path through a fiber optic cable.
Modulation - The process by which
the characteristic of one wave (the carrier) is modified by another wave (the
information signal). Examples include amplitude modulation (AM), and frequency
modulation (FM).
Monochromatic - Consisting of a
single wavelength. In practice, radiation is never perfectly monochromatic but,
at best, displays a narrow band of wavelengths.
Multi-mode fiber optic cable -
Type of fiber optic cable that support more than 1 propagation mode.
Multiplexing - The process by
which 2 or more signals are transmitted over a single transmission medium.
Examples include Time Division Multiplexing (TDM) and Wavelength Division
Multiplexing (WDM).
NA - Numerical
Aperture - The light gathering ability of a fiber optic cable. This defines the
maximum angle to the fiber optic cable axis at which light will be accepted and
propagated down the fiber optic cable. NA= SIN F, where F is the acceptance angle. NA is also
used to describe the angular spread of light from the central axis - as in
exiting from the fiber optic cable, emitting from a source of entering a
detector.
NA mismatch loss - The loss of
power at a joint that occurs when the transmitting half has an NA greater than
the NA of the receiving half. The loss occurs when coupling light from a source
to a fiber optic cable, from fiber optic cable to fiber optic cable or from
fiber optic cable to a detector.
NM - Nanometer 1 billionth of a
meter.
NEC - National Electrical Code.
Defines building flammability requirements for indoor cables.
NEXT - Near End cross-talk.
NIR - Near Infrared.
NIU - Network Interface Unit.
NLO - Non-Linear Optics.
NRZ - On-Off signaling code.
Numerical Aperture - See
NA-Numerical Aperture. This is the imaginary cone which defines the acceptance
area for the fiber optic cable core to accept light rays.
Open Standard Interconnect
- A 7-layer model defined by ISO for defining a data communication network. It
provides means for executing the blue print of the network architecture.
Optical cable - An assembly of
fiber optic cables and other material providing mechanical and environmental
protection.
Optical fiber - Synonym for fiber
optic cable.
Optical fiber coupler - This is
used in 2 contexts. In the first it refers to a device whose purpose is to
distribute optical power among 2 or more ports. In the second it refers to a
device whose purpose is to couple power between a fiber optic cable and a
source or detector.
Optical link - Any optical
transmission channel designed to connect 2 end terminals or to be connected in
series with other channels. Sometimes terminal hardware i.e. transmitter and
receiver, is included in the definition.
Optical time domain reflectometry
- A method of evaluating fiber optic cables based upon detecting backscattered
(reflected) light. It is used to measure attenuation, evaluate splice and
connector joints and locate faults.
Optical waveguide - Synonym for
fiber optic cable.
Optical window - Wavelength range
of a fiber optic cable with a very low attenuation. Fiber optic data links
using LED sources work in the 1st window at 850 nm or in the 2nd
window at 1300 nm. Fiber optic data links using laser sources work in the 2nd
window at 1310 nm or in the 3rd window at 1550 nm.
OPTI-GIGA™ - Graded index plastic
fiber optic cable developed by Boston Optical Fiber.
OPTI-LUX™ - Step index plastic
fiber optic cable developed by Boston Optical Fiber.
OPTI-MEGA™ - Step index plastic
fiber optic cable developed by Boston Optical Fiber.
Opto-electrical Converter -
Converts an optical signal into an electrical signal.
Opto-electronics - The range of
materials and devices that generate light (lasers and light-emitting devices),
amplify light (optical amplifiers), detect light (photodiodes) and control
light (electro-optic circuits). Each of these functions requires electrical
energy to operate and depends upon electronic devices to sense and control this
energy. In a broader sense it means pertaining to a device that responds to
optical power, emits or modifies optical radiation or utilizes optical
radiation for its internal operation. It is any device which functions as an
electrical to optical transducer or optical to electrical transducer.
OSI - Open Standards Interconnect.
OTDR - Optical Time Domain
Reflectometer. A method of characterizing a fiber optic cable wherein an
optical pulse is transmitted down the fiber optic cable and the resulting
backscatter and reflections are measured as a function of time. The OTDR is
useful in estimating the attenuation coefficient as a function of distance and
identifying defects and other localized losses.
Passive Star Coupler
- Couples 1 or more input optical signals coming from fiber optic cables to 1
or more output fiber optic cables acting as receivers. It accomplishes this by
using only passive optical components.
Patch Panel - Distribution area to
rearrange fiber optic cable connections and circuits. A simple patch panel is a
metal frame. One side of the panel is usually fixed. This means that the fiber
optic cables are not intended to be disconnected. On the other side are plugs
to connect other fiber optic cables.
PC - Physical contact.
PCM - Pulse Code Modulation.
PCS - Plastic clad silica.
PD - Photodiode
PE - Polyethylene. This is a type
of plastic material used to make cable jacketing.
Peak Wavelength - The wavelength
at which the optical power of a source is at a maximum.
PF - Perfluorinated
Photocurrent - The electrical
current that flows through a photosensitive device, such as a photodiode as a
result of exposure to radiant power.
Photodetector - An optoelectronic
transducer, such as a pin photodiode or avalanche photodiode.
Photodiode - A semiconductor diode
that produces current in response to incident optical power and used as a
detector in a fiber optic cable data link.
Photon - A quantum of
electromagnetic energy. A discrete unit which lends a particle nature to light
in contrast to its wave nature. Photons come into play when one talks about energy
exchanges using light.
Photonics - The technology of
transmission of information using light.
Physical contact connector - A
connector designed with a radiuses tip to assure physical contact of the fiber
optic cables and thereby increase return reflection loss.
Pigtail - A short length of fiber
optic cable, permanently fixed to a component. It is used to couple power
between the component and the fiber optic cable used for transmission.
PIN - Positive intrinsic negative
photodiode.
PIN Photodiode - A diode with a
large intrinsic region sandwiched between p+ and n- doped semi-conducting
regions. Photons absorbed in this region create electron-hole pairs that are
then separated by an electric field. This generates an electric current in a
load circuit.
PIN-PD - PIN-photodiode.
Pistoning - The movement of a
fiber optic cable axially in and out of a ferrule end, often caused by changes
in temperature.
Plastic clad silica fiber optic cable
- A fiber optic cable having a glass core and a plastic cladding.
Plastic fiber optic cable - Fiber
optic cables having a plastic core and plastic cladding.
Plenum - The air handling space
between walls, under structural floors and above drop ceilings. This can be
used to route intra-building cabling.
Plenum cable - Fiber optic cables
whose flammability and smoke characteristic allows it to be routed in a plenum
area without being enclosed in a conduit.
PMMA - Polymethylmethacrylate
POF Consortium - Over 60 Japanese
companies, government agencies and universities organized to promote plastic
optical fiber-plastic fiber optic cable.
POF - Plastic Optical
Fiber-plastic fiber optic cable.
POFA - Plastic optical fiber
amplifier.
POFIG - US based POF interest
group.
Point-to-Point - A fixed link
secured between 2 distinct nodes or stations in a network.
Polarization stability - The
variation in insertion loss as the polarization state of the input light is
varied.
Polishing - Preparing the end of a
fiber optic cable by moving the end over an abrasive material.
POLO - Parallel Optical Link
Organization.
POLYGUIDE® - Polymer
optical waveguide developed by DuPont.
Power meter - Device used to
measure attenuation of a plastic fiber optic cable.
Primary coating - The plastic
coating applied directly to the cladding surface of the fiber optic cable
during manufacture to preserve the integrity of the surface.
Preform - A solid rod of plastic
material from with a plastic fiber optic cable is drawn or a glass structure
for which glass fiber optic cable is drawn.
Prefusing - Fusing with low
current to clean the fiber optic cable end. Precedes fusion splicing.
Primary coating - The plastic
coating applied directly to the cladding surface of the fiber optic cable during
manufacture to preserve the integrity of the surface.
PTFE - Poly-tetrafluoroethylene, a
representative of perfluoropolymer by DuPont and manufactured under the name
Teflon®.
Pulse coded modulation - PCM. A
technique in which, a analog signal is converted to a digital signal. This is
accomplished by sampling the signals amplitude and expressing the different
amplitudes as a binary number. Sampling must be at the Nyquist rate - at least
twice the highest frequency in the information signal bandwidth.
Pulse spreading - The dispersion
of an optical signal with time as it propagates through a fiber optic cable.
PUR - Polyurethane. Material used
in manufacture of a type of jacketing material.
PVC - Polyvinyl Chloride. Material
used in manufacture of a type of jacketing material.
Quaternary - Made
from 4 different elements.
Quantum efficiency - In a
photodiode, the ratio of the primary carriers (electron-hole pairs) created to
incident photons. A quantum efficiency of 70% means 7 out of 10 incident photons
creates a carrier.
Rayleigh scattering
- The scattering of light that results from small inhomogeneities in material
density or composition. This causes losses in optical power. The losses vary
with the 4th power of wavelength. This scattering sets a theoretical
lower limit to the attenuation of a propagating lightwave as a function of
wavelength. This varies from 10 dB/km at 0.5 microns to 1 dB/km at 0.95
microns.
RAYTELA® - Plastic,
fiber optic cable manufactured by Toray Industries.
RB - Rhodamine B dopant.
Receiver - In the context of a
fiber optic cable based communications link it is an electronic package, which
converts optical signals to electrical signals.
Receiver sensitivity - The minimum
acceptable value of average received power at the fiber optic cable receiver
point, R, in order to achieve a BER of 10-12. It takes into account
power penalties caused by the use of a transmitter with worst-case values of
extinction ratio, jitter, pulse rise and fall times, optical return loss at the
transmitter point, S, receiver connector degradations and measurement
tolerances. The receiver sensitivity does not include penalties associated with
dispersion, jitter or reflections from the optical path. These effects are
specified separately in the allocation of maximum optical path penalty.
Sensitivity takes into account worst-case operating and end-of life conditions.
In the case of digital signals the optical power is usually quoted in Watts or
dBm.
Reflectance - Light that is
reflected back along the path of transmission, from either the coupling region,
the connector or the terminated fiber optic cable.
Reflection - The abrupt change in
direction of light as it travels from one material to a dissimilar material.
Some of the reflected power gets transmitted back to the source.
Refraction - The bending of a beam
of light at an interface between 2 dissimilar media or a medium whose
refractive index is a continuous function of position (i.e. a graded index
medium).
Refractive Index - The ratio of
the velocity of light in a vacuum to its velocity in the medium. It is a
synonym of index of refraction. Its symbol in 'n.'
Regenerative repeater - A repeater
designed for digital transmission that both amplifies and reshapes the signal.
Sometimes called regenerator.
Repeater - An optoelectronic
device that amplifies or boosts a signal. Basically, it returns a signal to its
original strength.
Responsivity - The ratio of a
photodetector's electrical output to its optical input in Amperes/Watt.
Return loss - Same as reflectance.
Return reflection - Reflected
optical energy that propagates backward to the source in a fiber optic cable.
Return reflection loss - The
attenuation of reflected light. High return loss is desirable, especially in
single-mode fiber optic cables.
Ring network - A network topology
in which terminals are connected in a point to point serial fashion in an
unbroken circular configuration. Frequently used with a token passing access
protocol.
Rise time - The time required for
the leading edge of a pulse to rise from 10% to 90% of its amplitude. The time
required for a component to produce such a result. Turn on time. Sometimes
measured between the 20% and 80% points.
Riser - Application for indoor
cables that pass between floors. It is normally a vertical shaft or space.
RX - Receiver.
RZ - Signaling code.
SC - A connector
type. It is primarily used with single-mode fiber optic cables. It offers low
cost, simplicity and durability. Furthermore, it provides for accurate
alignment by a ceramic ferrule. It is a push on -pull off connector with a
locking tab. It is similar to the connector used for FDDI but is not
compatible.
Scattering - A property of glass
which causes light to deflect from the fiber optic cable and contributes to
losses.
SDM - Space Domain Multiplexing
Semiconductor Laser - Same as a
laser diode.
Sensitivity - For a fiber optic
cable receiver it is the minimum optical power required to achieve a specified
level of performance, such as BER. Alternatively, it is the minimum amount of
energy required by a receiver for successful operation.
Shot noise - Noise caused by
random current fluctuations arising from the discrete nature of electrons.
Signal to noise ratio - The ratio
of signal power to noise power.
Silica - Glass material, nearly
pure SiO2.
SI-POF - Step index plastic fiber
optic cable.
Simplex - Transmission in only 1
direction.
Simplex cable - A term sometimes
used for a single-fiber cable.
Single-mode - A small core, fiber
optic cable that supports only 1 mode of light propagation above the cutoff
wavelength. Typically, the diameter of the core is 9-10 mm. Dispersion and power loss through
the cable walls are low with this type of cable. It is proper for long distance
transmission.
SMA - A connector type. This was
the predecessor of the ST connector. It features a threaded cap and housing.
The use of the SMA connector has decreased markedly in recent years being
replaced by the ST and SC connectors.
SNR, S/N - Signal to noise ratio.
Usually expressed in dB.
Soliton - An optical pulse that
does not suffer dispersion as it propagates over a distance.
SONET - Synchronous Optical
Network. An international standard for fiber optic cable based telephony.
Source - There is 2 possibilities.
First, it is a generator of information or data. Secondly, within the context
of fiber optics it is a light emitter, either an LED or laser diode, for a
fiber optic cable based link.
Spectral attenuation - Measure for
the attenuation in dependence on wavelength.
Spectral bandwidth (Between half power
points) - It is the wavelength interval in which a radiated spectral
quantity is not less than half its maximum value. It is a measure of the extent
of the spectrum. For a light source typical spectral widths are 20 to 60 nm for
a LED and 2 to 5 nm for a laser diode.
Spectral width - The measure of
the wavelength extent of a spectrum. It is usually based upon the 50% intensity
points. When referring to the spectral width of sources, typical spectral
widths are 20 to 60 nm for a LED and 2 to 5 nm for a laser diode.
Splice - An interconnection method
for joining the ends of 2 fiber optic cables in a permanent or semi-permanent
fashion. Thermal fusing may carry out splicing or it may be mechanical.
Splicing - The permanent joining
of fiber optic cable ends to identical or similar fiber optic cables without
using a connector. See also Fusion splicing and Mechanical splicing.
Splice box - Housing for 1 or more
splice organizers. The changeable front panel can be equipped with different
connector plugs.
Splice closure - A container used
to organize and protect splice trays.
Splice organizer - An organizer
panel that holds up to 12 splices with splice protectors and sufficient loops.
ST - A keyed bayonet connector
type similar to a BNC connector. It is used for both multi-mode and single-mode
fiber optic cables. Its use is wide spread. It has the ability both to be
inserted into and removed from a fiber optic cable both quickly and easily.
Method of location is also easy. There are 2 versions ST and ST-II. These are
keyed and spring loaded. They are a push in and twist type.
Star coupler - A coupler for a
fiber optic cable in which power at any input port is distributed to all output
ports.
Star network - A network in which
all terminals is connected through a single point, such as a star coupler.
Steady state - Equilibrium mode
distribution.
Step index fiber - A fiber optic
cable, either multi-mode or single-mode, in which the core refractive index is
uniform throughout so that a sharp step in refractive index occurs at the
core-to-cladding interface.
Step index profile - A refractive
index profile in which the refractive index changes abruptly from the value n1
to n2 at the core cladding interface.
Strength member - That part of a
fiber optic cable composed of Kevlar Aramid yarn, steel strands or fiberglass
filaments that increases the tensile strength of the cable.
Stripping - Removing the coating
from a fiber optic cable.
Tap loss - In a
fiber optic cable coupler is the ratio of power at the tap port to the power at
the input port.
Tap port - In a fiber optic cable
coupler in which the splitting ratio between output ports is not equal it is
the output port containing the lesser power.
TDM - Time Division Multiplexing.
Tee coupler - A 3 port optical
coupler.
10Base-F - A fiber optic cable
based version of an IEEE 802.3 network.
10Base-FB - That portion of a
10Base-F network that defines the requirements for the fiber optic cable
backbone network.
10Base-FL - That portion of a
10Base-F network that defines the fiber optic cable link between a concentrator
and a station.
10Base-FP - That portion of a
10Base-F network that defines a passive star coupler.
10Base-T - A twisted pair cable
version of an IEEE 802.3 network.
10Base-2 - A thin coaxial cable
version of an IEEE 802.3 network.
10Base-5 - A thick coaxial cable
version of an IEEE 802.3 network; very similar to the original Ethernet
specification.
Ternary - Made from 3 different
elements.
Thermal noise - Noise resulting
from thermally induced random fluctuation in current in the receiver's load
resistance.
Thermal stability - A measure of
the insertion loss variation as the device undergoes various environmental changes.
Throughput loss - In a fiber optic
cable coupler it is the ratio of power at the throughput port to power at the
input port.
Tight buffer - Type of cable
construction whereby each glass fiber optic cable is tightly buffered by a
protective thermoplastic coating to a diameter of 900 microns. High tensile
strength rating achieved, providing durability, ease of handling and ease of
connectorization.
Time Division Multiplexing - TDM.
A transmission technique whereby several low speed channels share a given
transmission medium, for example a fiber optic cable. With this technique they
share it on a time basis. Each channel is given specific time slots to transmit
during and can only transmit during these time slots.
Token ring - A ring based networking
scheme. A token is used to control access to the network. Used by IEEE 802.5
and FDDI.
Total bandwidth - The combined
modal and chromatic bandwidth.
Total internal reflection - Total
reflection of light back into a material when it strikes the interface of a
material having a lower index at an angle below the critical angle.
Transduce - A device for
converting energy from one form to another, such as optical energy to
electrical energy.
Transceiver - A combination of
transmitter and receiver providing both output and input interfaces with a
device.
Transmission loss - Total loss
encountered in transmission through a system.
Transmitter - In the context of a
fiber optic cable based communication link an electrical package, which
converts an electrical signal to an optical signal.
Tree coupler - A passive fiber
optical component in which power from 1-input is distributed to more than 2-output
fiber optic cables.
TX - Transmitter.
UL - Underwriters
Laboratories, Inc.
Ultraviolet - Optical radiation
for which the wavelengths are shorter than those for visible radiation, that is
approximately between 1 nm and 400 nm.
Uniformity - The maximum insertion
loss difference between ports of a coupler.
UV - Ultraviolet.
VCSL - Vertical
cavity semiconductor laser.
Velocity of light - The velocity
of light is 300,000 km/sec in a vacuum. In a medium it depends in the
refractive index and the wavelength.
WAN - Wide Area
Network. A network of connected computers that cover a great geographical area.
Waveguide - A 2 dimensional
substrate which carries light in channels inscribed in the material.
Wavelength - Distance an
electromagnetic wave travels in the time it takes to oscillate through a
complete cycle. Wavelengths of light are measured in nanometers (10-9
m) or micrometers (10-6 m).
Wavelength dependence - The
variation in an optical parameter caused by a change in the operating
wavelength.
Wavelength Division Multiplexer -
A passive fiber optical device used to separate optical signals of different
wavelengths carried on 1 fiber optic cable.
Wavelength Division Multiplexing -
WDM. Simultaneous transmission of several optical signals of different
wavelengths on the same fiber optic cable. It is a technique used so that
several different communications channels can share the same fiber optic cable.
WDM - Wavelength Division
Multiplexing.
WIC - Wavelength Independent
Coupler.
mW
- MicroWatt.
Bibliography
Bibliography
1. Green, Lynne D., Fiber Optic
Communications, CRC Press, Boca Raton, FL, 1993.
2. Johnson, Howard W., Fast
Ethernet Dawn Of A New Network, Prentice-Hall, Upper Saddle River, NJ, 1996.
3. Palais, Joseph C., Fiber Optic
Communications Third Edition, Prentice Hall, Englewood Cliffs, NJ, 1992.
4. Sterling, Donald J.,
Technician's Guide to Fiber Optics Second Edition, Delmar Publishers, Inc.
Albany, NY, 1993.
5. Technical Staff of SCELT, Fiber
Optic Communications Handbook Second Edition, TAB Books, Blue Ridge Summit, PA,
1990.
I hope that you have benefited from reading this monograph. If you have any
questions please feel free to call me at 1-800-835-3298.
Copyright 1999 Telebyte, Inc. All rights reserved.